Statistics : Sampling Distributions I
Ideas, facts & insights covering these topics:
8 ideas
·438 reads
2
Explore the World's Best Ideas
Join today and uncover 100+ curated journeys from 50+ topics. Unlock access to our mobile app with extensive features.

Factors that influence sampling distribution
The number observed in a population: The symbol for this variable is "N." It is the measure of observed activity in a given group of data.
The number observed in the sample: The symbol for this variable is "n." It is the measure of observed activity in a random sample of data that is part of the larger grouping.
The method of choosing the sample: How you chose the samples can account for variability in some cases.
10
83 reads
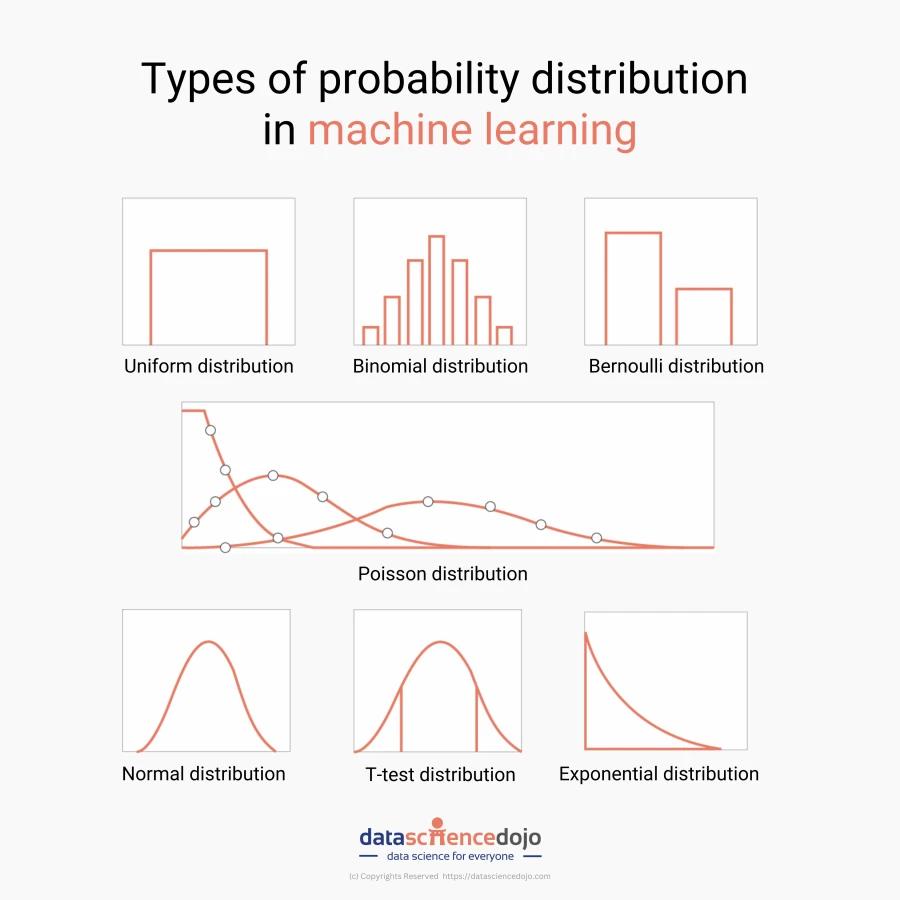
Types of distributions
1. Sampling distribution of mean
2. Sampling distribution of proportion
3. T-distribution
10
86 reads
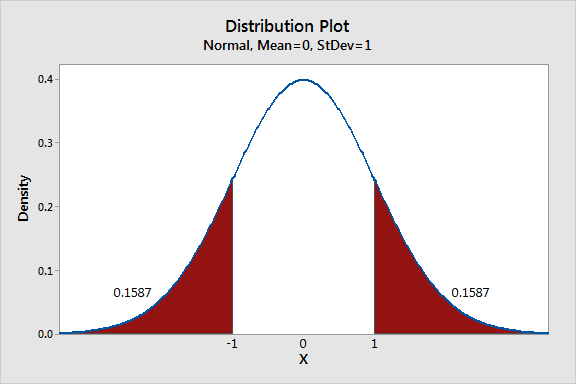
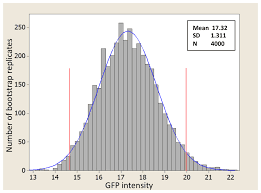
1. Sampling distribution of mean
It focuses on calculating the mean of every sample group chosen from the population and plotting the data points.
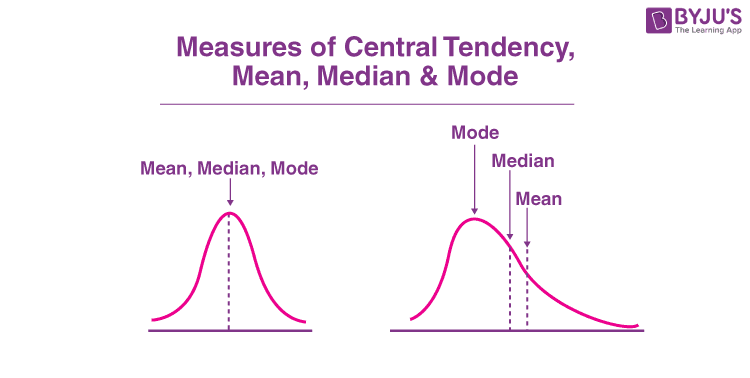
The graph shows a normal distribution where the center is the mean of the sampling distribution, which represents the mean of the entire population.
10
56 reads
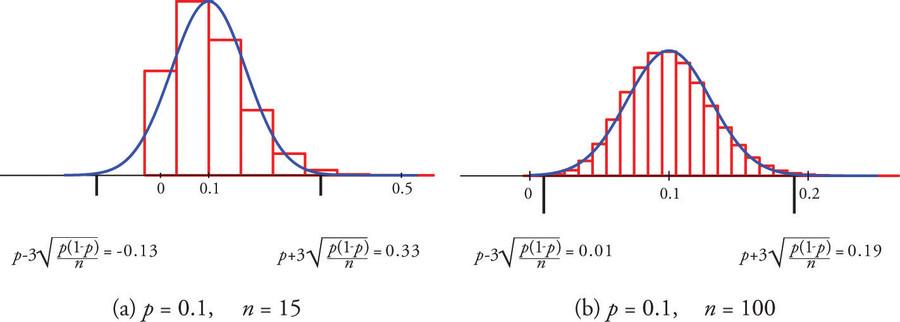
2. Sampling distribution of proportion
his sampling distribution focuses on proportions in a population. You select samples and calculate their proportions.
The means of the sample proportions from each group represent the proportion of the entire population
10
52 reads
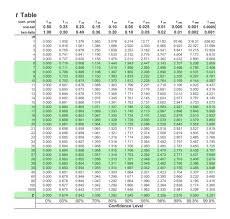
3. T-distribution
Distribution that involves a small population or one where you don't know much about it.
It is used to estimate the mean of the population and other statistics such as confidence intervals, statistical differences and linear regression.
The T-distribution uses a t-score to evaluate data that wouldn't be appropriate for a normal distribution.
10
36 reads
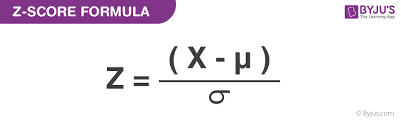
t-Score
T score us used in 1 tailed or 2 tailed | Confidence interval.
Requirments:
- Population standard deviation is not given
- n
Then calculate Upper Bound and lower bound.
10
40 reads
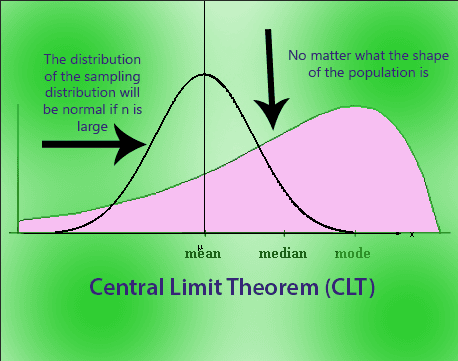
Central Limit Theorem
The sampling distribution of the mean will always be normally distributed, as long as the sample size is large enough.
Multiple samples, n>= 30.
Sample mean is populated in pdf.
And then creates Normal distribution.
10
38 reads

IDEAS CURATED BY

CURATOR'S NOTE
The probability of an event based on data from a small group within a large population. Its primary purpose is to establish representative results of small samples of a comparatively larger population.
“
Similar ideas

10 ideas
12 ideas
How to Lie with Statistics
Darrell Huff
Read & Learn
20x Faster
without
deepstash
with
deepstash
with
deepstash
Personalized microlearning
—
100+ Learning Journeys
—
Access to 200,000+ ideas
—
Access to the mobile app
—
Unlimited idea saving
—
—
Unlimited history
—
—
Unlimited listening to ideas
—
—
Downloading & offline access
—
—
Supercharge your mind with one idea per day
Enter your email and spend 1 minute every day to learn something new.
I agree to receive email updates