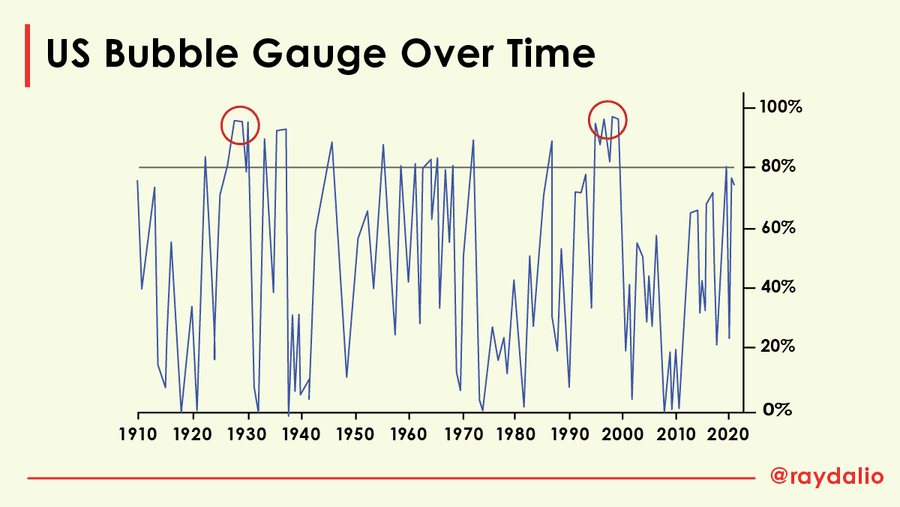
Each of these six influences is measured using a number of stats that are combined into gauges. In the stock market we do it for each stock that we are looking at. These gauges are combined into aggregate indices by security and then for the market as a whole. The table below shows the current readings of each of these gauges for the US equity market as a whole, and the chart below it shows the aggregate reading derived by combining these gauges into one reading for the stock market going back to 1910. It shows how the conditions stack up today for US equities in relation to past times.
21
100 reads
CURATED FROM
IDEAS CURATED BY
The idea is part of this collection:
Learn more about moneyandinvestments with this collection
How to create and sell NFTs
The future of NFTs
The benefits and drawbacks of NFTs
Related collections
Similar ideas
Agile Estimation and Planning
1. Planning Poker: All participants use numbered playing cards and estimate the items. Voting is done anonymous and discussion is raised when there are large differences. Voting is repeated till the whole team reached consensus about the accurate estimation. Planning poker works well when you hav...
Read & Learn
20x Faster
without
deepstash
with
deepstash
with
deepstash
Personalized microlearning
—
100+ Learning Journeys
—
Access to 200,000+ ideas
—
Access to the mobile app
—
Unlimited idea saving
—
—
Unlimited history
—
—
Unlimited listening to ideas
—
—
Downloading & offline access
—
—
Supercharge your mind with one idea per day
Enter your email and spend 1 minute every day to learn something new.
I agree to receive email updates
