1. Sampling distribution of mean
It focuses on calculating the mean of every sample group chosen from the population and plotting the data points.
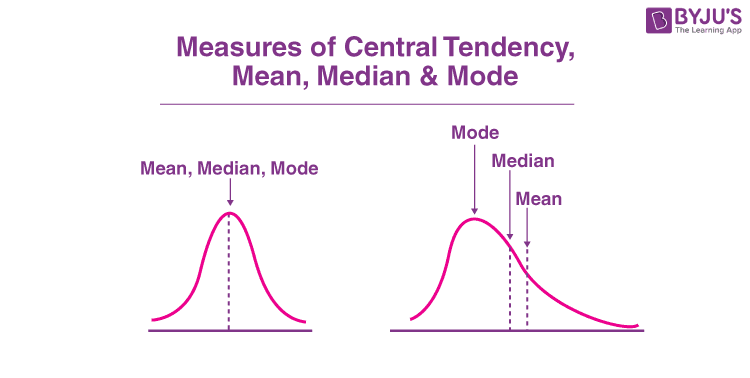
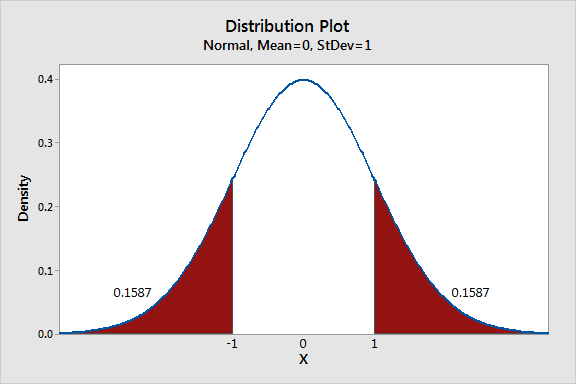
The graph shows a normal distribution where the center is the mean of the sampling distribution, which represents the mean of the entire population.
9
61 reads
CURATED FROM
IDEAS CURATED BY

The probability of an event based on data from a small group within a large population. Its primary purpose is to establish representative results of small samples of a comparatively larger population.
“
Similar ideas to 1. Sampling distribution of mean
System 1 Thinking
The main function of System 1 is to maintain and update a model of your personal world, which represents what is normal in it.
Consider driving your car from home to work on a quiet road.
You understand the tasks involved, such as using your car's indicators, ...
Kinds Of Biohacking
- Vipassana Meditation where one lays off any kind of sensory stimulants for weeks, or Intermittent Fasting, where one does not eat anything for 12 to 18 hours, are common biohacks for centuries.
- Today, biohacking can mean altering your body’s cells/DNA, or injectin...

Origin of The Cobra Effect
The term ‘Cobra Effect’ originates from Colonial India, which was under the rule of the Britishers. To tackle the problem of the growing number of cobras, the British government announced a bounty on every dead cobra. Enterprising locals started breeding cobras and kept on claiming the bounty...
Read & Learn
20x Faster
without
deepstash
with
deepstash
with
deepstash
Personalized microlearning
—
100+ Learning Journeys
—
Access to 200,000+ ideas
—
Access to the mobile app
—
Unlimited idea saving
—
—
Unlimited history
—
—
Unlimited listening to ideas
—
—
Downloading & offline access
—
—
Supercharge your mind with one idea per day
Enter your email and spend 1 minute every day to learn something new.
I agree to receive email updates