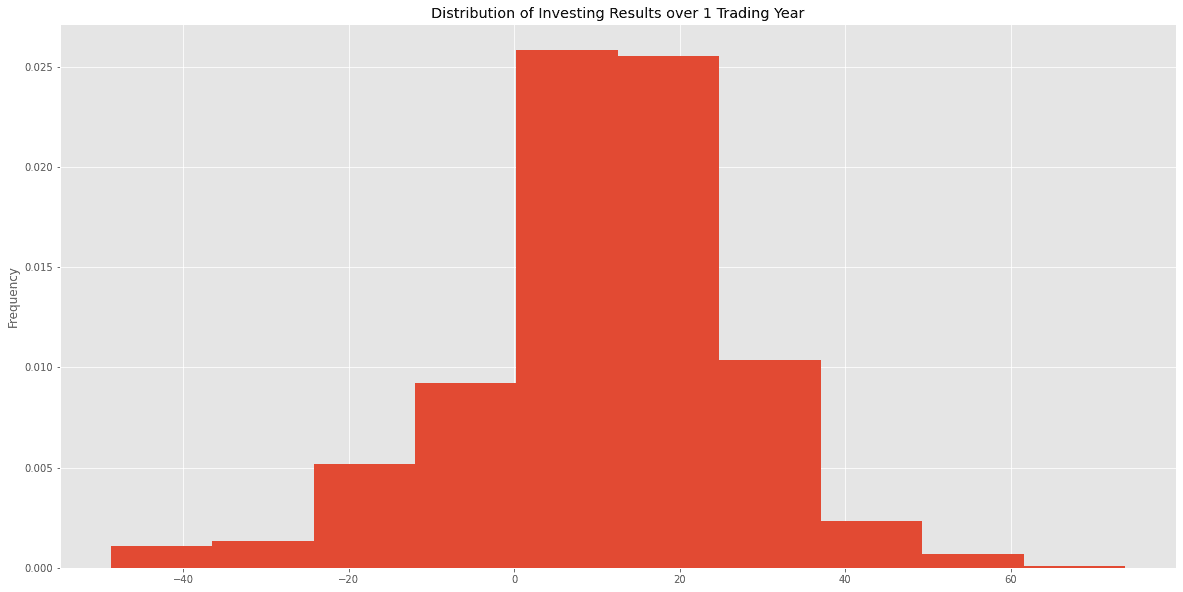
Do stocks only go up?
We took the data set from the SP500 Yahoo Finance Historical Data and tested it.
We only had open and close data from 1982 and after.
Methodology: Rather than measuring calender years, we measured trading years on a daily basis. Every day of every year we looked back 1 trading year and measured the results.
Results:
Over 9930 Periods, 7727 of periods the SP500 was higher than the same day in the previous trading year. It was never the exact same. 1950 it was lower.
Mean returns were 10.6%
Median returns were 11.96%
1
16 reads
CURATED FROM
IDEAS CURATED BY
Interest in Programming, Data Science and Investments. Love discussing economics and behavioral psychology.
The idea is part of this collection:
Learn more about moneyandinvestments with this collection
How to create and sell NFTs
The future of NFTs
The benefits and drawbacks of NFTs
Related collections
Read & Learn
20x Faster
without
deepstash
with
deepstash
with
deepstash
Personalized microlearning
—
100+ Learning Journeys
—
Access to 200,000+ ideas
—
Access to the mobile app
—
Unlimited idea saving
—
—
Unlimited history
—
—
Unlimited listening to ideas
—
—
Downloading & offline access
—
—
Supercharge your mind with one idea per day
Enter your email and spend 1 minute every day to learn something new.
I agree to receive email updates
