Presentation Matters
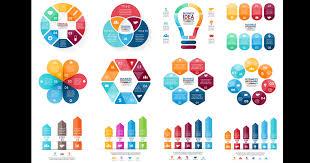
Use visuals like charts, graphs, or infographics. A well-placed visual can make your data more engaging and easier to understand.
4
49 reads
CURATED FROM
IDEAS CURATED BY
I wanted to share my thoughts on the subject.
“
Similar ideas to Presentation Matters
Infographics
Information graphics or data visualization (infographics) are graphic visual representations of information, data or knowledge intended to present information quickly and clearly to a live or online audience.
Infographics are making a big impact in communicating about compl...
The “Death By PowerPoint”
Using slides as visual aids can support our theories, but beware the all-too-familiar “death by PowerPoint”. Try making only one clear point per slide, avoid visual clichés, and keep graphs or charts streamlined and simple. Clarity and legibility are all. With ideas that are comp...
#10-#11
Include visuals
- Images make posts more appealing to readers and trigger emotions.
- Make sure to create your own graphics, infographics, and videos.
Focus on telling a story
- Apply the key rules of storytelling, aligning wit...
Read & Learn
20x Faster
without
deepstash
with
deepstash
with
deepstash
Personalized microlearning
—
100+ Learning Journeys
—
Access to 200,000+ ideas
—
Access to the mobile app
—
Unlimited idea saving
—
—
Unlimited history
—
—
Unlimited listening to ideas
—
—
Downloading & offline access
—
—
Supercharge your mind with one idea per day
Enter your email and spend 1 minute every day to learn something new.
I agree to receive email updates

