Infographics
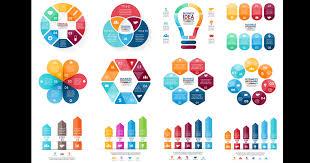
Information graphics or data visualization (infographics) are graphic visual representations of information, data or knowledge intended to present information quickly and clearly to a live or online audience.
Infographics are making a big impact in communicating about complex topics, making information eye-catching, shareable and easily digestible.
405
827 reads
CURATED FROM
IDEAS CURATED BY
The idea is part of this collection:
Learn more about communication with this collection
Understanding the importance of decision-making
Identifying biases that affect decision-making
Analyzing the potential outcomes of a decision
Related collections
Read & Learn
20x Faster
without
deepstash
with
deepstash
with
deepstash
Personalized microlearning
—
100+ Learning Journeys
—
Access to 200,000+ ideas
—
Access to the mobile app
—
Unlimited idea saving
—
—
Unlimited history
—
—
Unlimited listening to ideas
—
—
Downloading & offline access
—
—
Supercharge your mind with one idea per day
Enter your email and spend 1 minute every day to learn something new.
I agree to receive email updates
