Discrete uniform distribution
Uniform distribution refers to a statistical distribution in which all outcomes are equally likely.
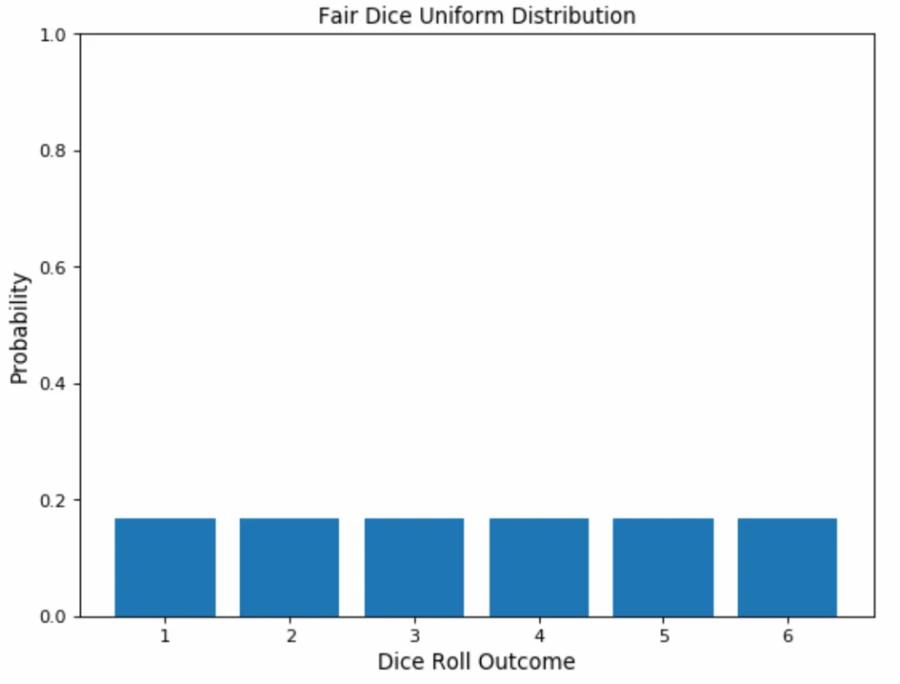
Consider rolling a six-sided die. You have an equal probability of obtaining all six numbers on your next roll, i.e., obtaining precisely one of 1, 2, 3, 4, 5, or 6, equaling a probability of 1/6, hence an example of a discrete uniform distribution.
As a result, the uniform distribution graph contains bars of equal height representing each outcome. In our example, the height is a probability of 1/6 (0.166667).
20
97 reads
CURATED FROM
IDEAS CURATED BY
A data distribution is a graphical representation of data that was collected from a sample or population. It is used to organize and disseminate large amounts of information in a way that is meaningful and simple for audiences to digest.
“
Read & Learn
20x Faster
without
deepstash
with
deepstash
with
deepstash
Personalized microlearning
—
100+ Learning Journeys
—
Access to 200,000+ ideas
—
Access to the mobile app
—
Unlimited idea saving
—
—
Unlimited history
—
—
Unlimited listening to ideas
—
—
Downloading & offline access
—
—
Supercharge your mind with one idea per day
Enter your email and spend 1 minute every day to learn something new.
I agree to receive email updates
