Statistics : Data Distributions II
Ideas, facts & insights covering these topics:
20 ideas
·1.5K reads
9
Explore the World's Best Ideas
Join today and uncover 100+ curated journeys from 50+ topics. Unlock access to our mobile app with extensive features.
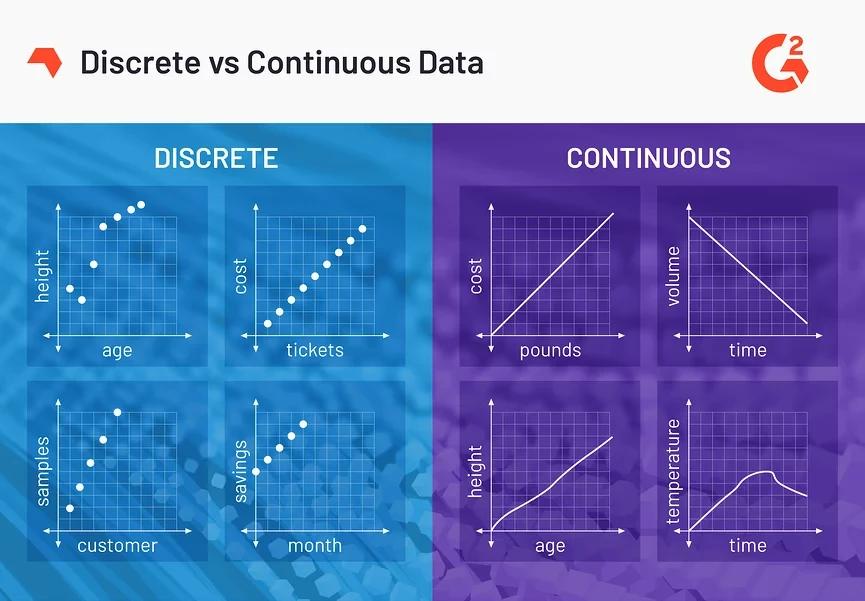
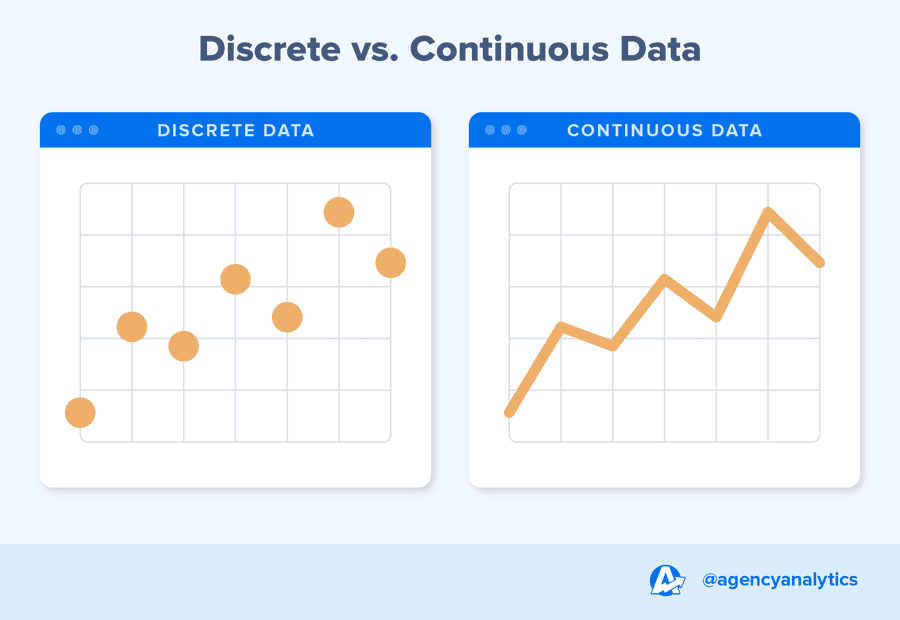
Types of data - Discrete Data
When you roll a die or pick a card from a deck, you have a limited number of outcomes possible.
This type of data is called Discrete Data, which can only take a specified number of values.
23
210 reads
Types of data - Continuous Data
Recording time or measuring a person’s height has infinitely many values within a given interval.
This type of data is called Continuous Data, which can have any value within a given range.
That range can be finite or infinite.
20
151 reads
Discrete Data Distributions
- Discrete uniform distribution: All outcomes are equally likely
- Bernoulli Distribution: Single-trial with two possible outcomes
- Binomial Distribution: A sequence of Bernoulli events
- Poisson Distribution: The probability that an event may or may not occur
- chi-square distribution
- Uniform distribution
22
162 reads
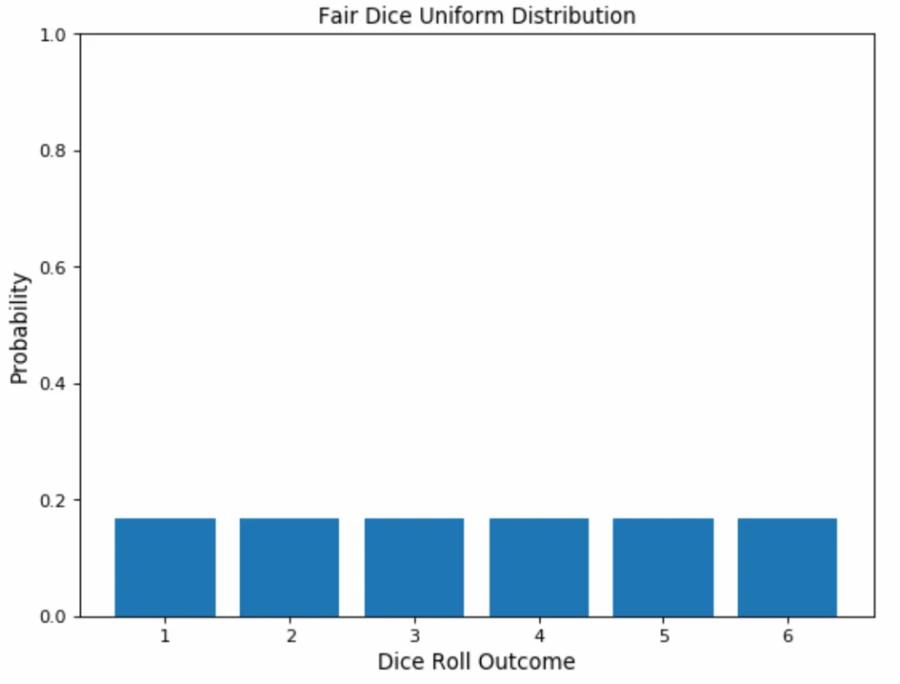
Discrete uniform distribution
Uniform distribution refers to a statistical distribution in which all outcomes are equally likely.
Consider rolling a six-sided die. You have an equal probability of obtaining all six numbers on your next roll, i.e., obtaining precisely one of 1, 2, 3, 4, 5, or 6, equaling a probability of 1/6, hence an example of a discrete uniform distribution.
As a result, the uniform distribution graph contains bars of equal height representing each outcome. In our example, the height is a probability of 1/6 (0.166667).
20
97 reads
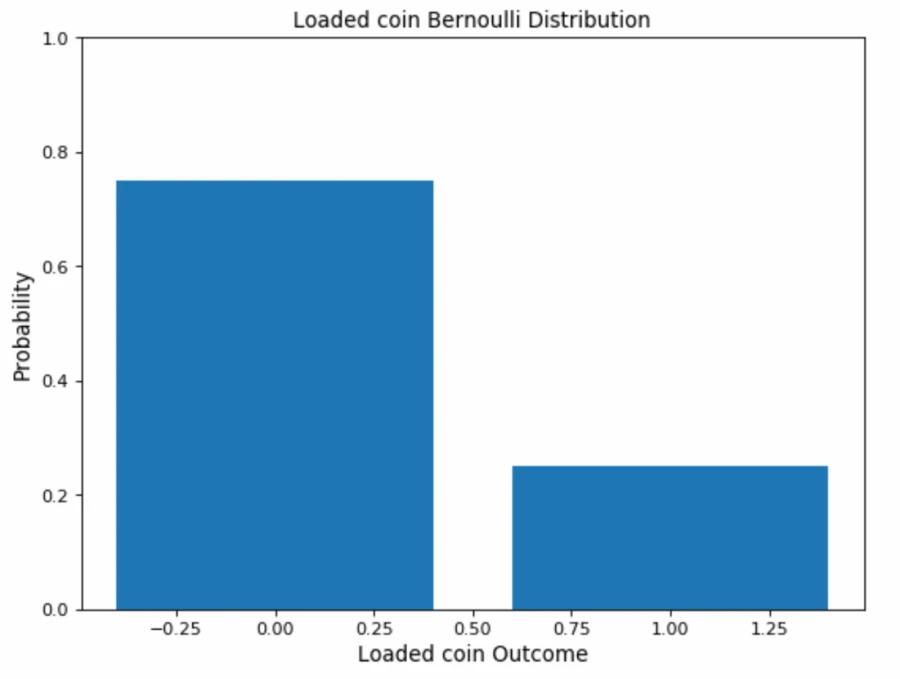
Bernoulli Distribution:
It can be used as a starting point to derive more complex distributions.
Any event with a single trial and only two outcomes follows a Bernoulli distribution. Flipping a coin or choosing between True and False in a quiz are examples of a Bernoulli distribution.
We have the probability of one of the outcomes (p). From (p), we can deduce the probability of the other outcome by subtracting it from the total probability (1), represented as
(1-p).
p(Head)= 0.3
p(Tail)= q = 1-p = 1- 0.3 = 0.7
Used for categorical variables.
20
93 reads

Binomial Distribution: A sequence of Bernoulli events
Sum of outcomes of an event following a Bernoulli distribution.
Therefore, Binomial Distribution is used in binary outcome events, and the probability of success and failure is the same in all successive trials.
An example of a binomial event would be flipping a coin multiple times to count the number of heads and tails.
B(n,p) where
n = number of trails
p=success of probability of each trail
20
90 reads
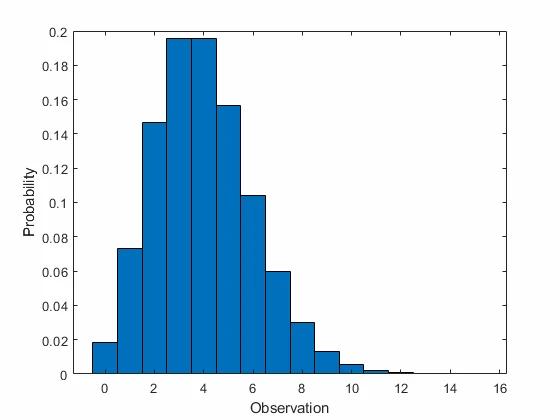
Poisson Distribution
Poisson distribution deals with the frequency with which an event occurs within a specific interval.
Instead of the probability of an event, Poisson distribution requires knowing how often it happens in a particular period or distance.
For eg. a cricket chirps two times in 7 seconds on average. We can use the Poisson distribution to determine the likelihood of it chirping five times in 15 seconds.
Represented with the notation Po(λ), λ represents the expected number of events that can take place in a period.
The expected value and variance of a Poisson process is λ
X -discrete random variable.
19
82 reads
Continuous Data Distributions
- Normal Distribution: Symmetric distribution of values around the mean
- Student t-Test Distribution: Small sample size approximation of a normal distribution
- Exponential distribution: Model elapsed time between two events
- Weibull Distribution
- Non-normal distributions
- Lognormal distribution
- F distribution
20
71 reads
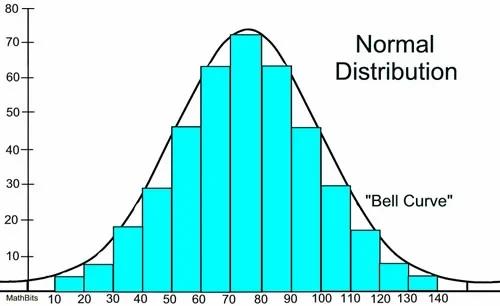
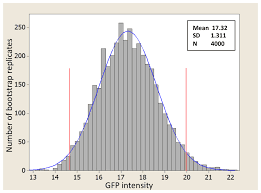
Normal Distribution
Here, data is symmetrically distributed with no skew.
When plotted, the data follows a bell shape, with most values clustering around a central region and tapering off as they go further away from the center.
Represented as N(µ, σ2) ; sample mean and variance.
20
65 reads
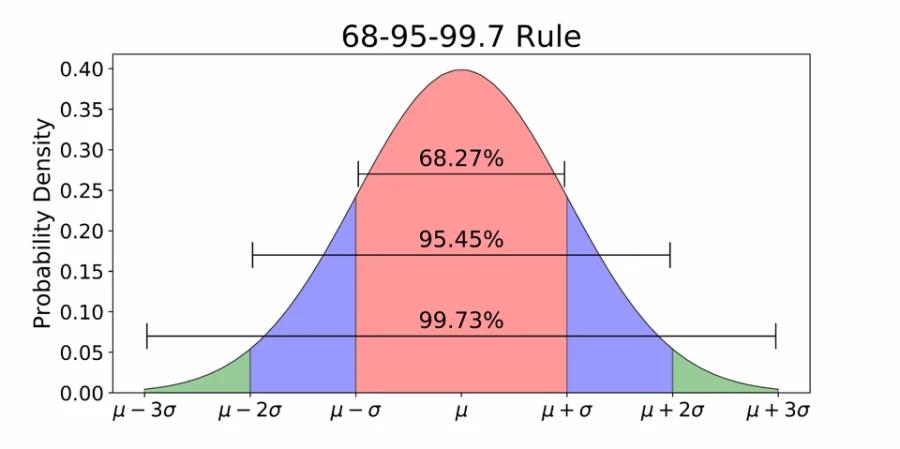
68-95-99.7 Rule
The curve is symmetric at the center.
Therefore mean, mode, and median are equal to the same value, distributing all the values symmetrically around the mean.
The area under the distribution curve equals 1 (all the probabilities must sum up to 1).
68-95-99.7 Rule
68% of the data points will fall within one standard deviation of the mean.
95% of the data points will fall within two standard deviations of the mean.
99.7% of the data points will fall within three standard deviations of the mean.
19
61 reads

Student t-Test Distribution
A type of statistical distribution similar to the normal distribution with its bell shape but has heavier tails.
The t distribution is used instead of the normal distribution when you have small sample sizes.
For example, suppose we deal with the total apples sold by a shopkeeper in a month. In that case, we will use the normal distribution. Whereas, if we are dealing with the total amount of apples sold in a day, i.e., a smaller sample, we can use the t distribution.
20
54 reads
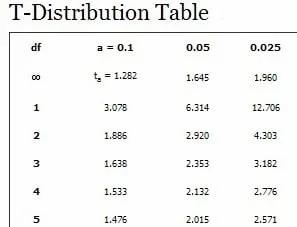
A difference in Students's t and Normal Distributions.
Critical difference between the students’ t distribution and the Normal one is that apart from the mean and variance, we must also define the degrees of freedom for the distribution.
In statistics, the number of degrees of freedom is the number of values in the final calculation of a statistic that are free to vary.
A Student’s t distribution is represented as t(k), where k represents the number of degrees of freedom. For k=2, i.e., 2 degrees of freedom, the expected value is the same as the mean.
19
45 reads
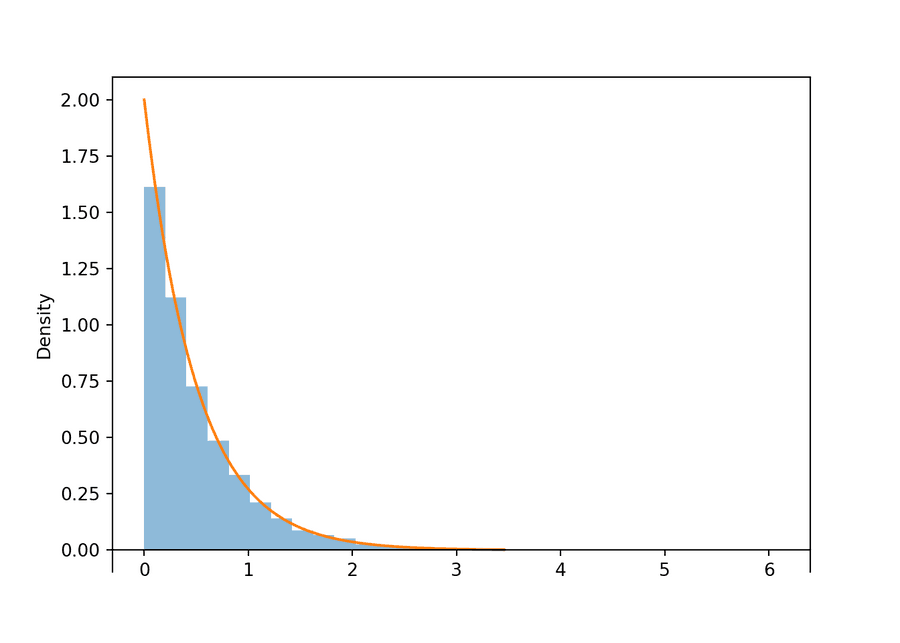
Exponential distribution
Exponential distribution is one of the widely used continuous distributions.
It is used to model the time taken between different events.
For example, in physics, it is often used to measure radioactive decay; in engineering, to measure the time associated with receiving a defective part on an assembly line; and in finance, to measure the likelihood of the next default for a portfolio of financial assets.
Another common application of Exponential distributions in survival analysis (e.g., expected life of a device/machine).
20
38 reads
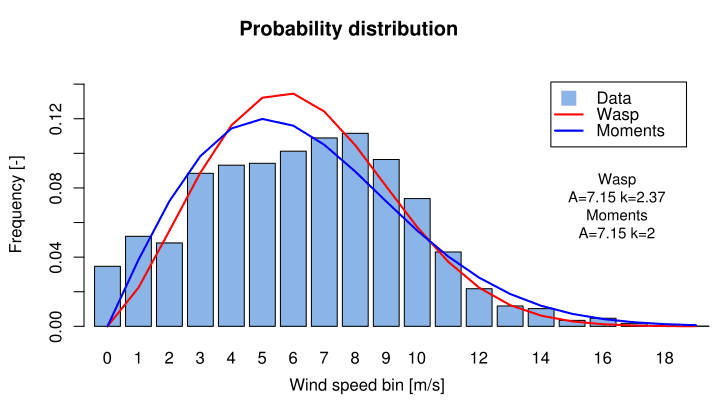
Weibull Distribution
It is a two-parameter family of curves.
Weibull Distributions measure data in an exponential curve – a curve beginning at zero and gradually increasing in value.
This data distribution is often used for reliability tests and can help us predict how long it will take for a system to fail.
It models a broad range of random variables, largely in the nature of a time to failure or time between events.
19
38 reads
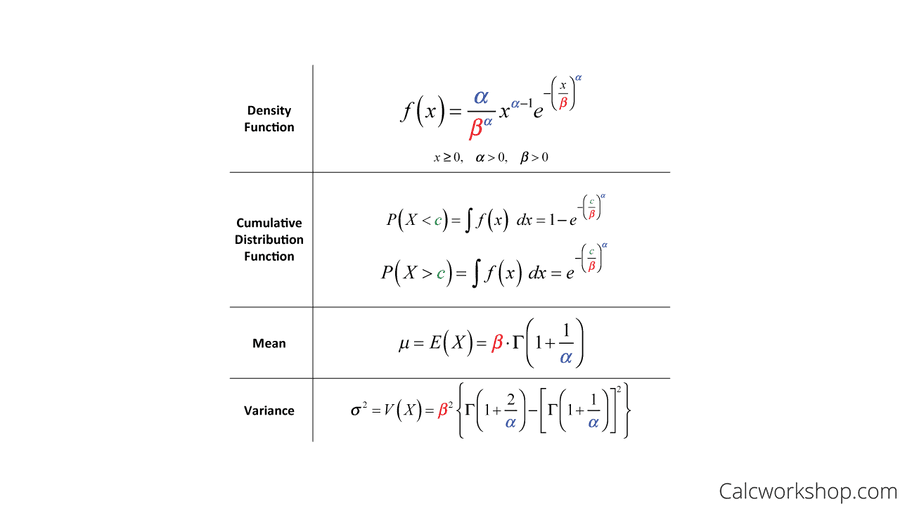
Weibull Distribution
Terms:
α is referred to as the shape parameter, and β is the scale parameter.
When α=1, the Weibull distribution is an exponential distribution with λ=1/β, so the exponential distribution is a special case of both the Weibull distributions and the gamma distributions.
19
39 reads
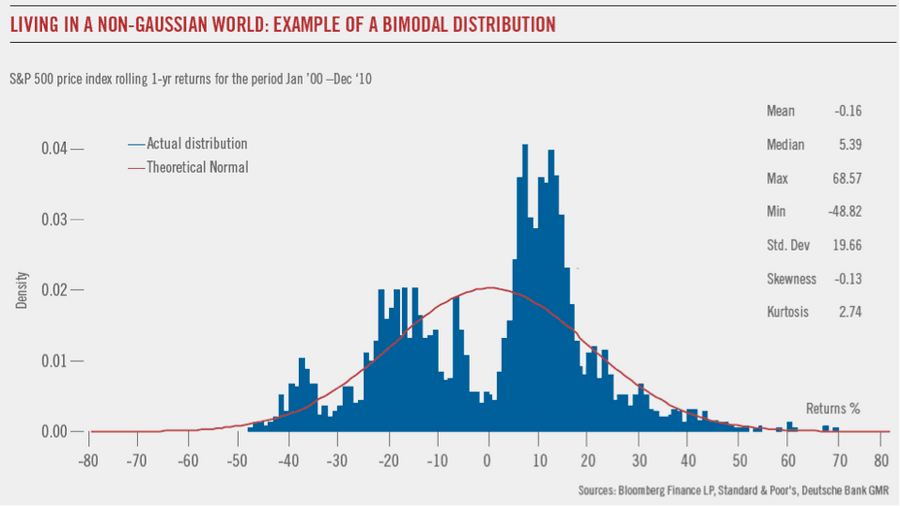
Non-normal distributions
It may lack symmetry, may have extreme values, or may have a flatter or steeper “dome” than a typical bell.
There is nothing inherently wrong with non-normal data; some traits simply do not follow a bell curve.
For example, data about coffee and alcohol consumption are rarely bell shaped.
19
40 reads
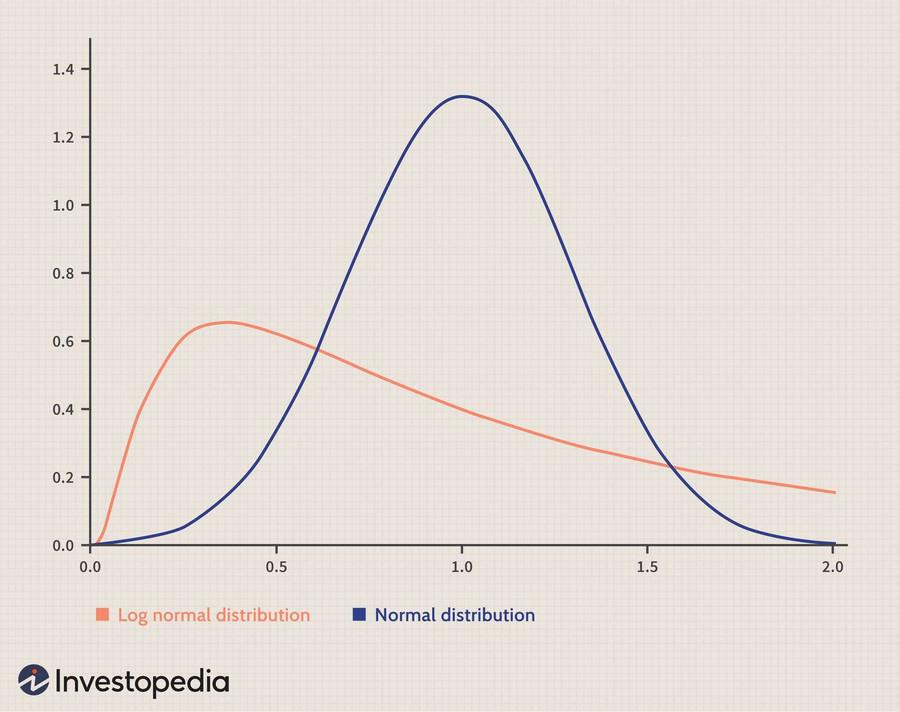
Lognormal distribution
Continuous probability distribution of a random variable whose logarithm is normally distributed.
Thus, if the random variable X is log-normally distributed, then Y = log(X) has a normal distribution.
Equivalently, if Y has a normal distribution, then the exponential function of Y, X = exp(Y) , has a log-normal distribution.
A random variable which is log-normally distributed takes only positive real values. It is a convenient and useful model for measurements in exact and engineering sciences, as well as medicine, economics and other topics (e.g., energies, concentrations, lengths).
19
36 reads

F distribution / Snedecor's F distribution
F-distribution or F-ratio, also known as or the Fisher–Snedecor distribution (after Ronald Fisher and George W. Snedecor), is a continuous probability distribution that arises frequently as the null distribution of a test statistic, most notably in the analysis of variance (ANOVA) and other F-tests.
19
36 reads
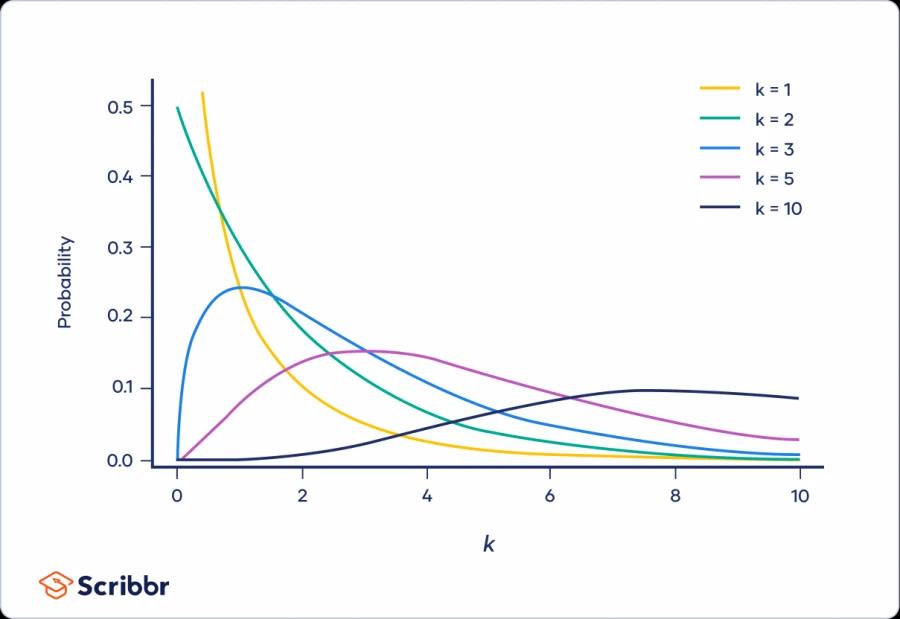
Chi-Square distribution
The graph above shows examples of chi-square distributions with different values of k(shape of a chi-square distribution).
They’re widely used in hypothesis tests, including the chi-square goodness of fit test and the chi-square test of independence.
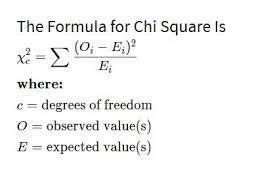
In hypothesis testing, steps
- Ho or H1
- significance value α =0.05
- Degree of freedom = n-1 ; n is number of categorical variables
- Decision Boundary - Cheak chi-square table
- calculate test statistics
Χ^2 = Σ (f o - f e) ^2 / f e
f e=expected outcome
f o=observed outcome
6 . P
19
38 reads
IDEAS CURATED BY

CURATOR'S NOTE
A data distribution is a graphical representation of data that was collected from a sample or population. It is used to organize and disseminate large amounts of information in a way that is meaningful and simple for audiences to digest.
“
Similar ideas


Read & Learn
20x Faster
without
deepstash
with
deepstash
with
deepstash
Personalized microlearning
—
100+ Learning Journeys
—
Access to 200,000+ ideas
—
Access to the mobile app
—
Unlimited idea saving
—
—
Unlimited history
—
—
Unlimited listening to ideas
—
—
Downloading & offline access
—
—
Supercharge your mind with one idea per day
Enter your email and spend 1 minute every day to learn something new.
I agree to receive email updates