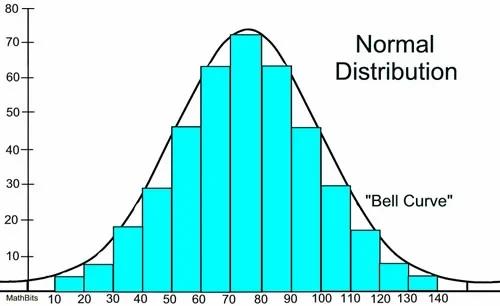
Normal Distribution
Here, data is symmetrically distributed with no skew.
When plotted, the data follows a bell shape, with most values clustering around a central region and tapering off as they go further away from the center.
Represented as N(µ, σ2) ; sample mean and variance.
20
65 reads
CURATED FROM
IDEAS CURATED BY
A data distribution is a graphical representation of data that was collected from a sample or population. It is used to organize and disseminate large amounts of information in a way that is meaningful and simple for audiences to digest.
“
Read & Learn
20x Faster
without
deepstash
with
deepstash
with
deepstash
Personalized microlearning
—
100+ Learning Journeys
—
Access to 200,000+ ideas
—
Access to the mobile app
—
Unlimited idea saving
—
—
Unlimited history
—
—
Unlimited listening to ideas
—
—
Downloading & offline access
—
—
Supercharge your mind with one idea per day
Enter your email and spend 1 minute every day to learn something new.
I agree to receive email updates
