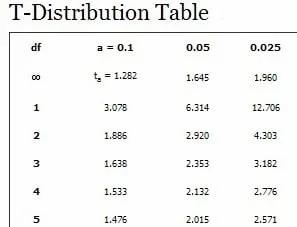
A difference in Students's t and Normal Distributions.
Critical difference between the students’ t distribution and the Normal one is that apart from the mean and variance, we must also define the degrees of freedom for the distribution.
In statistics, the number of degrees of freedom is the number of values in the final calculation of a statistic that are free to vary.
A Student’s t distribution is represented as t(k), where k represents the number of degrees of freedom. For k=2, i.e., 2 degrees of freedom, the expected value is the same as the mean.
19
45 reads
CURATED FROM
IDEAS CURATED BY
A data distribution is a graphical representation of data that was collected from a sample or population. It is used to organize and disseminate large amounts of information in a way that is meaningful and simple for audiences to digest.
“
Read & Learn
20x Faster
without
deepstash
with
deepstash
with
deepstash
Personalized microlearning
—
100+ Learning Journeys
—
Access to 200,000+ ideas
—
Access to the mobile app
—
Unlimited idea saving
—
—
Unlimited history
—
—
Unlimited listening to ideas
—
—
Downloading & offline access
—
—
Supercharge your mind with one idea per day
Enter your email and spend 1 minute every day to learn something new.
I agree to receive email updates
