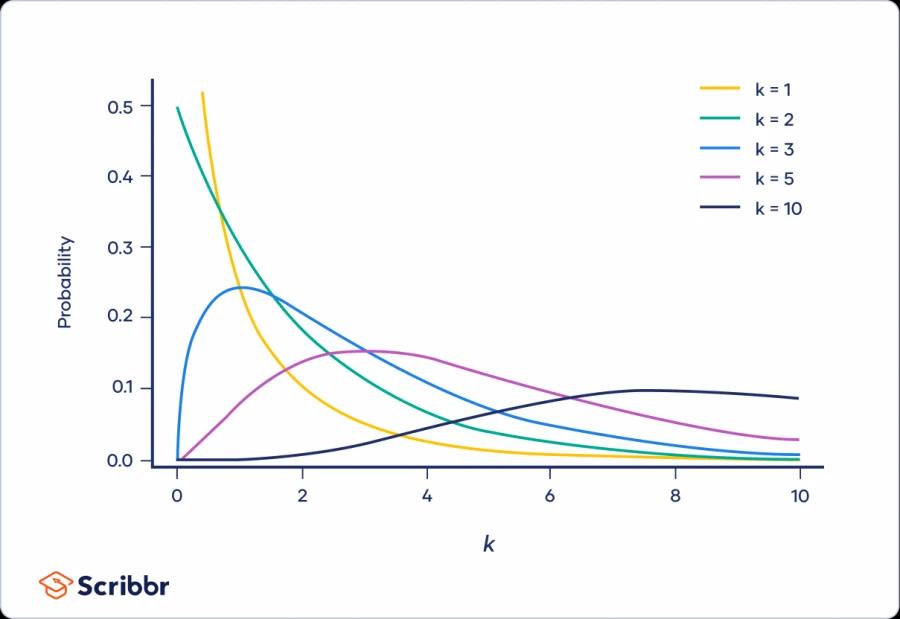
Chi-Square distribution
The graph above shows examples of chi-square distributions with different values of k(shape of a chi-square distribution).
They’re widely used in hypothesis tests, including the chi-square goodness of fit test and the chi-square test of independence.
In hypothesis testing, steps
- Ho or H1
- significance value α =0.05
- Degree of freedom = n-1 ; n is number of categorical variables
- Decision Boundary - Cheak chi-square table
- calculate test statistics
Χ^2 = Σ (f o - f e) ^2 / f e
f e=expected outcome
f o=observed outcome
6 . P
19
38 reads
CURATED FROM
IDEAS CURATED BY
A data distribution is a graphical representation of data that was collected from a sample or population. It is used to organize and disseminate large amounts of information in a way that is meaningful and simple for audiences to digest.
“
Read & Learn
20x Faster
without
deepstash
with
deepstash
with
deepstash
Personalized microlearning
—
100+ Learning Journeys
—
Access to 200,000+ ideas
—
Access to the mobile app
—
Unlimited idea saving
—
—
Unlimited history
—
—
Unlimited listening to ideas
—
—
Downloading & offline access
—
—
Supercharge your mind with one idea per day
Enter your email and spend 1 minute every day to learn something new.
I agree to receive email updates
