Gantt Chart
A Gantt chart is a visual representation of the individual tasks in a project. It’s a bar chart that would form part of your project plan with a calendar running along the top (x-axis) and the list of tasks running down the side (y-axis). Each task is represented as a bar along with the dates on which it is scheduled to occur. Related tasks can be linked to show their relationship.
44
233 reads
CURATED FROM

IDEAS CURATED BY

Self Motivated, Trauma Neutralizer, Lover of Persiflage & Communication!
Wanna be a certified PMP Project Manager? Follow me for curated information pertaining to the PMP certification.
“
Similar ideas to Gantt Chart
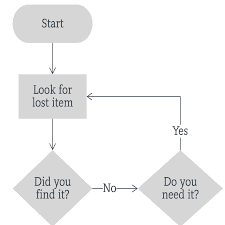
Flow-chart
Represented by individual steps that start from a problem and lead to a solution.
Each step is denoted by a different kind of shape which symbolizes whether the note requires action or decision. Unlike the timeline, a flow chart can veer in multiple directions, leading to different ...

The Eisenhower Matrix
Time commitment to get started: Medium
Type: Visual
Perfect for people who: Like graphs, have trouble seeing things in black-and-white, and would rather prioritize on a continuum than stuff tasks into a few categories.
W...
Paper Calendar
The easiest way to organize your day is a good paper calendar.
Divide it into four sections.
- The top left section is your running to do list for the day.
- The top right section is the running grocery list.
- The bottom left is for notes such as calls made, who you s...
Read & Learn
20x Faster
without
deepstash
with
deepstash
with
deepstash
Personalized microlearning
—
100+ Learning Journeys
—
Access to 200,000+ ideas
—
Access to the mobile app
—
Unlimited idea saving
—
—
Unlimited history
—
—
Unlimited listening to ideas
—
—
Downloading & offline access
—
—
Supercharge your mind with one idea per day
Enter your email and spend 1 minute every day to learn something new.
I agree to receive email updates