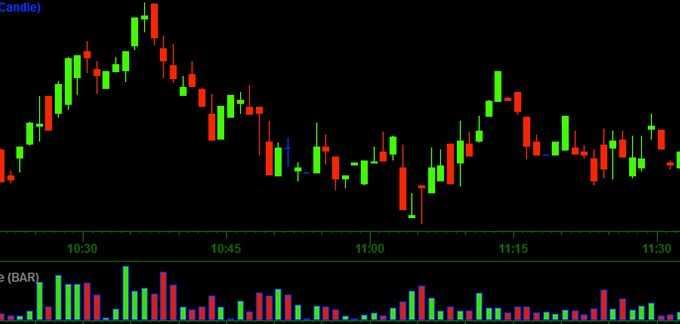
What are (Japanese) candlestick charts?
They originated in Japan the 1700s, as a way to measure the supply & demand of the rice markets:
- They show four price points (open, close, high, and low) throughout the period of time the trader specifies.
- They are used by traders to determine possible price movement based on past patterns.
- Candlesticks are useful when trading as
- Trading is often dictated by emotion, which can be read in candlestick charts.
95
1K reads
CURATED FROM
IDEAS CURATED BY

Life-long learner. Passionate about leadership, entrepreneurship, philosophy, Buddhism & SF. Founder @deepstash.
The idea is part of this collection:

Learn more about moneyandinvestments with this collection
How to manage risk
How to analyze investment opportunities
The importance of long-term planning
Related collections


Read & Learn
20x Faster
without
deepstash
with
deepstash
with
deepstash
Personalized microlearning
—
100+ Learning Journeys
—
Access to 200,000+ ideas
—
Access to the mobile app
—
Unlimited idea saving
—
—
Unlimited history
—
—
Unlimited listening to ideas
—
—
Downloading & offline access
—
—
Supercharge your mind with one idea per day
Enter your email and spend 1 minute every day to learn something new.
I agree to receive email updates