Explore the World's Best Ideas
Join today and uncover 100+ curated journeys from 50+ topics. Unlock access to our mobile app with extensive features.
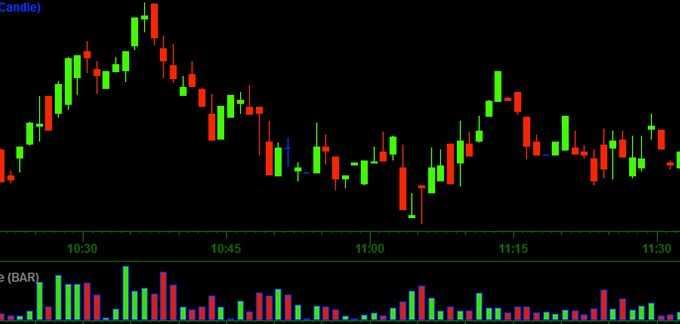
What are (Japanese) candlestick charts?
They originated in Japan the 1700s, as a way to measure the supply & demand of the rice markets:
- They show four price points (open, close, high, and low) throughout the period of time the trader specifies.
- They are used by traders to determine possible price movement based on past patterns.
- Candlesticks are useful when trading as
- Trading is often dictated by emotion, which can be read in candlestick charts.
95
1K reads
Candlestick Components
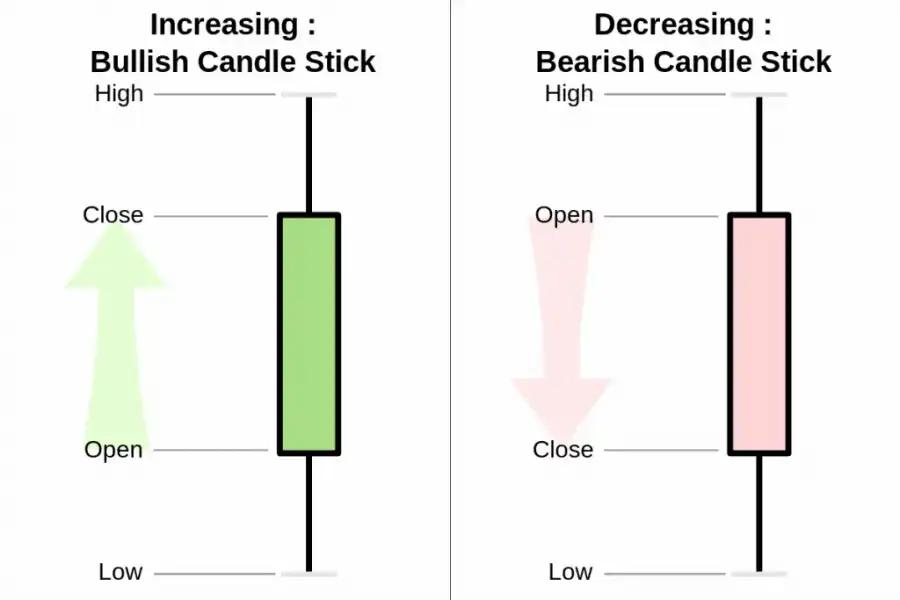
The candlestick has a wide part, which is called the "real body", and a narrow line called the "shadow":
- The body represents the price range between the open and close of that day's trading.
- When the real body is filled, black, or green it means the close was lower than the open. If the real body is empty, or red it means the close was higher than the open.
- The shadows show the high & low prices of that day's trading.
92
744 reads
Candlestick Patterns
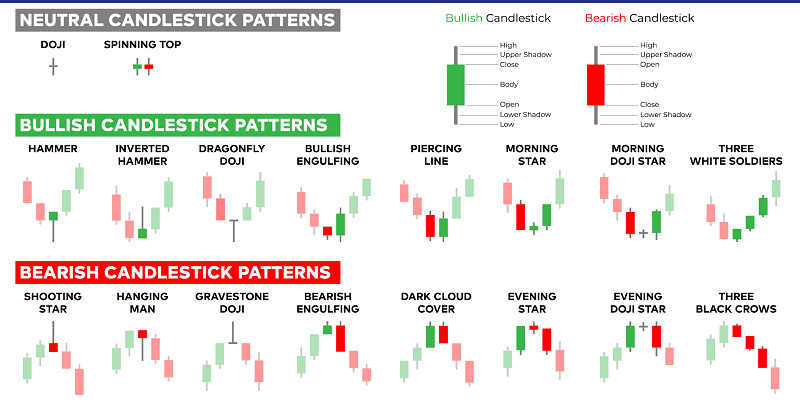
Patterns are separated into bullish & bearish. Bullish patterns indicate that the price is likely to rise, while bearish patterns indicate that the price is likely to fall. No pattern works all the time, as candlestick patterns represent tendencies in price movement, not guarantees.
114
819 reads
Engulfing Pattern
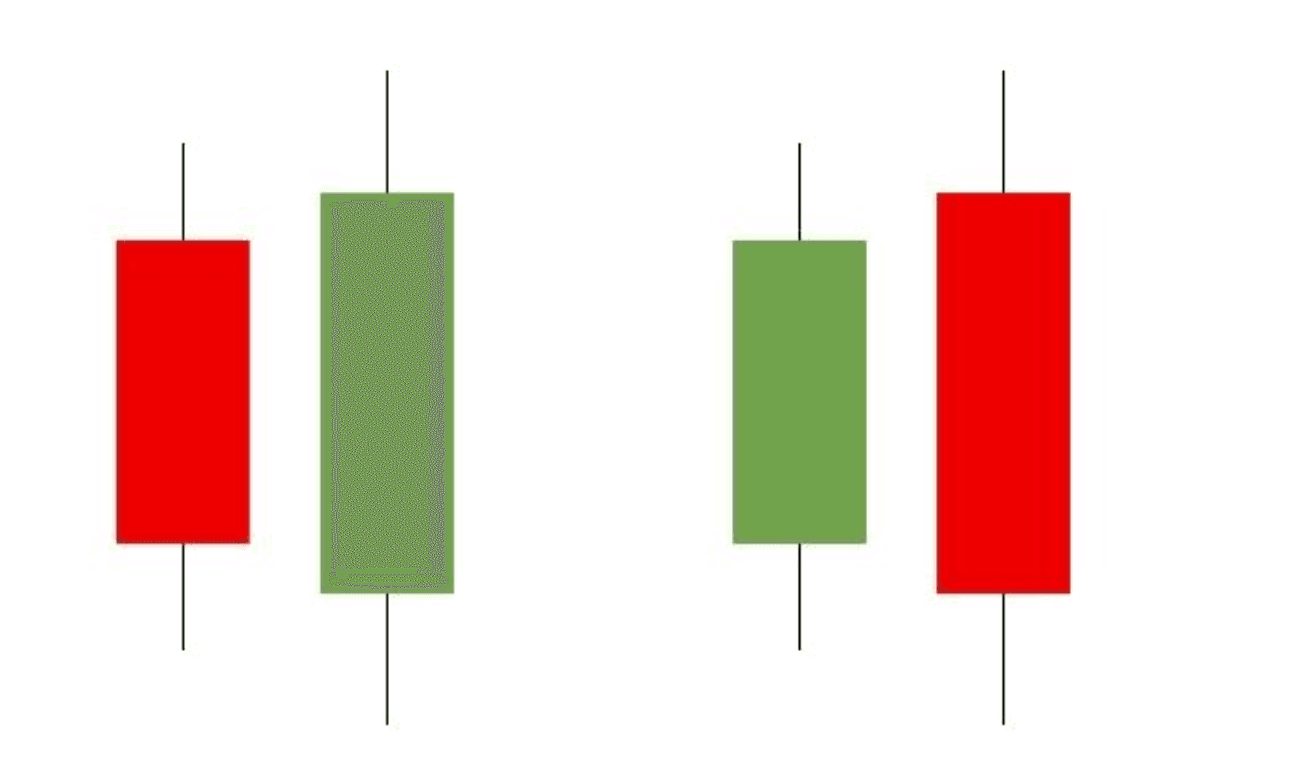
As seen in the illustration, the second candle completely overwhelms the prior candle:
- For a pattern to qualify as bullish engulfing, the high of the second candle should hit higher prices than the high of the prior candle. The same scenario applies for the low.
- Ideally, the closing price (top of the body) should also be higher than the highest point of the wick of the prior candle. This scenario gives further significance to the second candle and shows that the bulls have control over the price action now.
90
592 reads
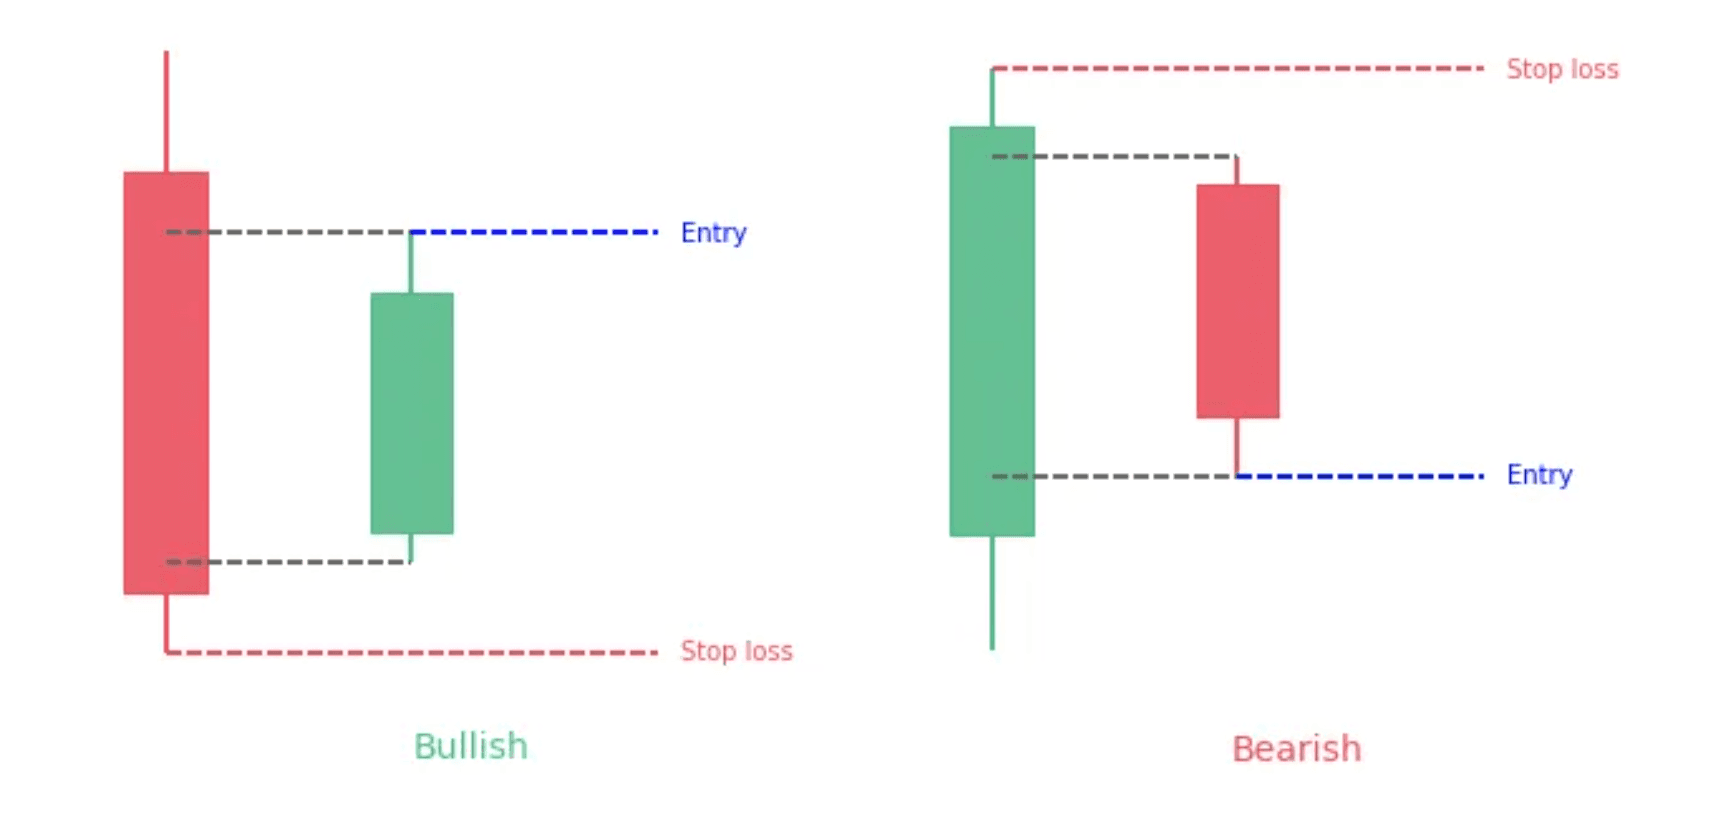
Harami Pattern
The first stick is large & the second one significantly smaller. Also the second candlestick is contained within the body of the first candlestick:
- Bearish: a small red body completely inside the previous day's real body. This is not so much a pattern to act on, but it could be one to watch. The pattern shows indecision on the part of the buyers.
- Bullish: A downtrend is in play, and a small real body (green) occurs inside the large real body (red) of the previous day. This tells the technician that the trend is pausing. If it is followed by another up day, more upside could be forthcoming.
91
582 reads
IDEAS CURATED BY
Life-long learner. Passionate about leadership, entrepreneurship, philosophy, Buddhism & SF. Founder @deepstash.
Vladimir Oane's ideas are part of this journey:
Learn more about moneyandinvestments with this collection
How to manage risk
How to analyze investment opportunities
The importance of long-term planning
Related collections
Similar ideas
12 ideas
Options Trading Strategies: A Guide for Beginners
investopedia.com
4 ideas
Heikin-Ashi: A Better Candlestick
investopedia.com
12 ideas
Read & Learn
20x Faster
without
deepstash
with
deepstash
with
deepstash
Personalized microlearning
—
100+ Learning Journeys
—
Access to 200,000+ ideas
—
Access to the mobile app
—
Unlimited idea saving
—
—
Unlimited history
—
—
Unlimited listening to ideas
—
—
Downloading & offline access
—
—
Supercharge your mind with one idea per day
Enter your email and spend 1 minute every day to learn something new.
I agree to receive email updates

