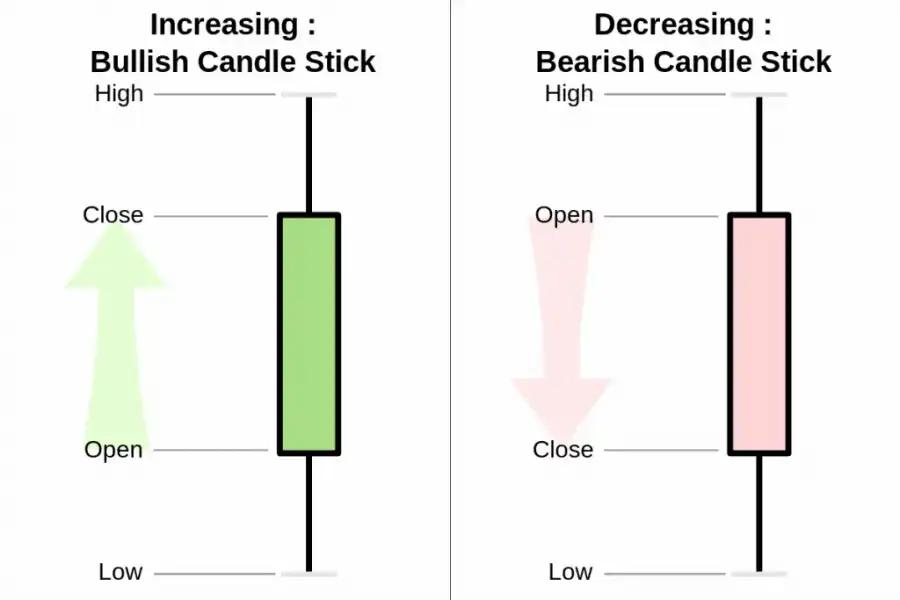
Candlestick Components
The candlestick has a wide part, which is called the "real body", and a narrow line called the "shadow":
- The body represents the price range between the open and close of that day's trading.
- When the real body is filled, black, or green it means the close was lower than the open. If the real body is empty, or red it means the close was higher than the open.
- The shadows show the high & low prices of that day's trading.
92
744 reads
CURATED FROM
IDEAS CURATED BY

Life-long learner. Passionate about leadership, entrepreneurship, philosophy, Buddhism & SF. Founder @deepstash.
The idea is part of this collection:

Learn more about moneyandinvestments with this collection
How to manage risk
How to analyze investment opportunities
The importance of long-term planning
Related collections


Read & Learn
20x Faster
without
deepstash
with
deepstash
with
deepstash
Personalized microlearning
—
100+ Learning Journeys
—
Access to 200,000+ ideas
—
Access to the mobile app
—
Unlimited idea saving
—
—
Unlimited history
—
—
Unlimited listening to ideas
—
—
Downloading & offline access
—
—
Supercharge your mind with one idea per day
Enter your email and spend 1 minute every day to learn something new.
I agree to receive email updates