
Cathie Wood: Time To Sell Stocks?
Curated from: Investing Made Simple - Nathan Sloan
Ideas, facts & insights covering these topics:
2 ideas
·986 reads
9
Explore the World's Best Ideas
Join today and uncover 100+ curated journeys from 50+ topics. Unlock access to our mobile app with extensive features.
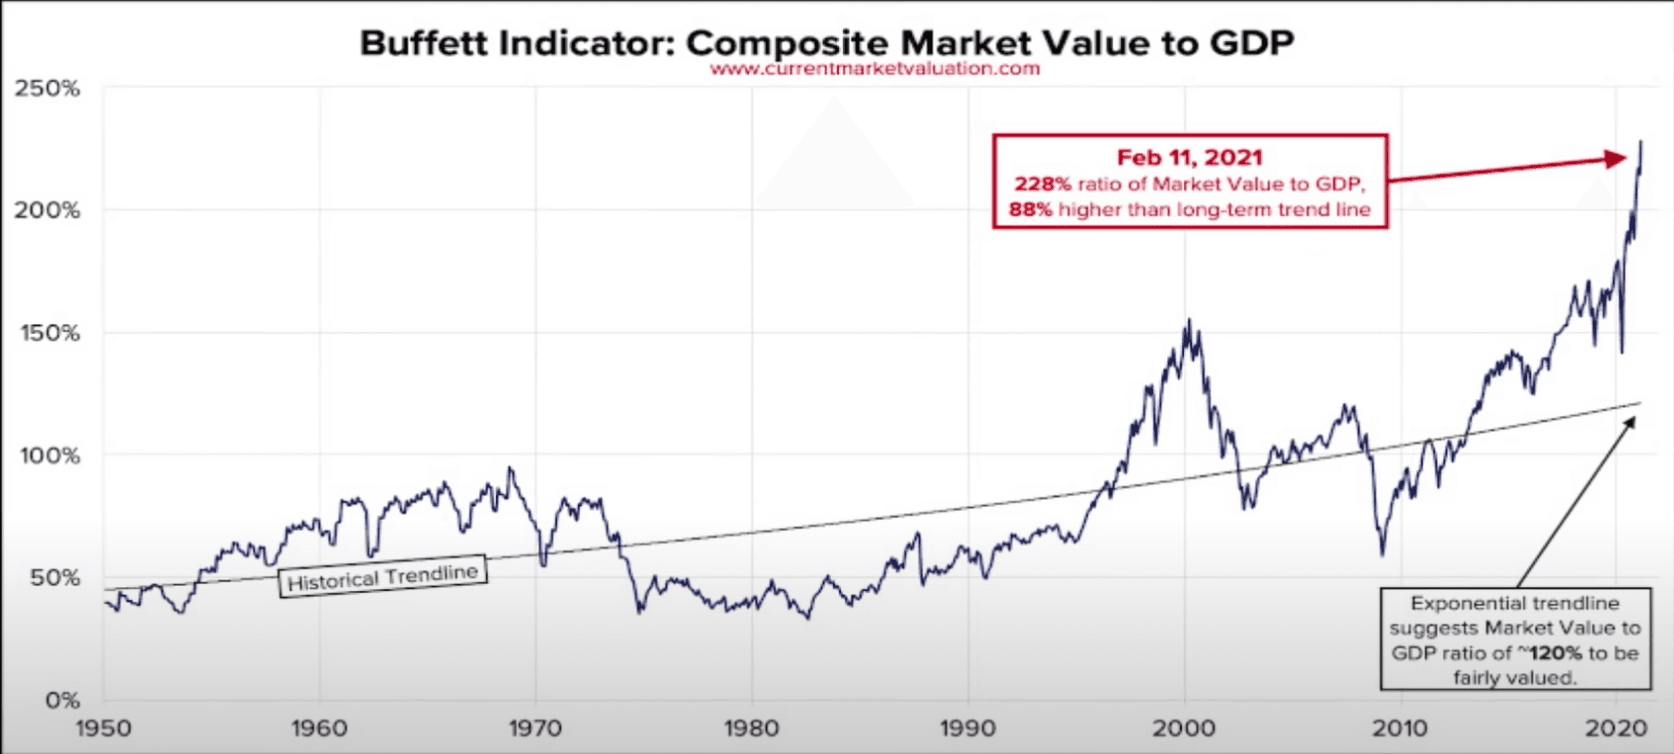
The Buffet Indicator
The Buffett Indicator is the ratio of total the United States stock market valuation to GDP. It is said to be the best predictor of market corrections or crashes.
As of May 6, 2021:
- Aggregate US Market Value: $51.8T
- Current Quarter Annualized GDP: $22.6T
- Buffett Indicator: $51.8T ÷ $22.6T = 229%
Historically, when the stock market went above GDP by 50-100% it crashed, going below GDP. 2021 is the year in the last 100 years when the ratio was over 2x the largest stock market in history.
60
720 reads
The impact of tech on the Buffet indicator
In 2021, Elon Musk asked Cathie Wood, the famous tech-focused investor from Ark investments, what is her explanation for the high Buffet indicator (a ratio of US stock market/GDP). Cathie suggests a few reasons:
- while the indicator maintained its pattern over the last 100 years, in the late 1800s was much higher, suggesting tech infection points (telephone. electricity & automobile back then)
- the new tech is deflationary, making lowering the basket included in GDP. So denominator goes down while the numerator.
- as bonds yields ~1-3%, money is gonna move to other assets, like stocks.
34
266 reads
IDEAS CURATED BY

Life-long learner. Passionate about leadership, entrepreneurship, philosophy, Buddhism & SF. Founder @deepstash.
Vladimir Oane's ideas are part of this journey:

Learn more about politics with this collection
The impact of opportunity cost on personal and professional life
Evaluating the benefits and drawbacks of different choices
Understanding the concept of opportunity cost
Related collections


Similar ideas
1 idea
How does a blockchain work - Simply Explained
Simply Explained
2 ideas
Cardano - Simply Explained
Simply Explained
1 idea
Proof-of-Stake (vs proof-of-work)
Simply Explained
Read & Learn
20x Faster
without
deepstash
with
deepstash
with
deepstash
Personalized microlearning
—
100+ Learning Journeys
—
Access to 200,000+ ideas
—
Access to the mobile app
—
Unlimited idea saving
—
—
Unlimited history
—
—
Unlimited listening to ideas
—
—
Downloading & offline access
—
—
Supercharge your mind with one idea per day
Enter your email and spend 1 minute every day to learn something new.
I agree to receive email updates