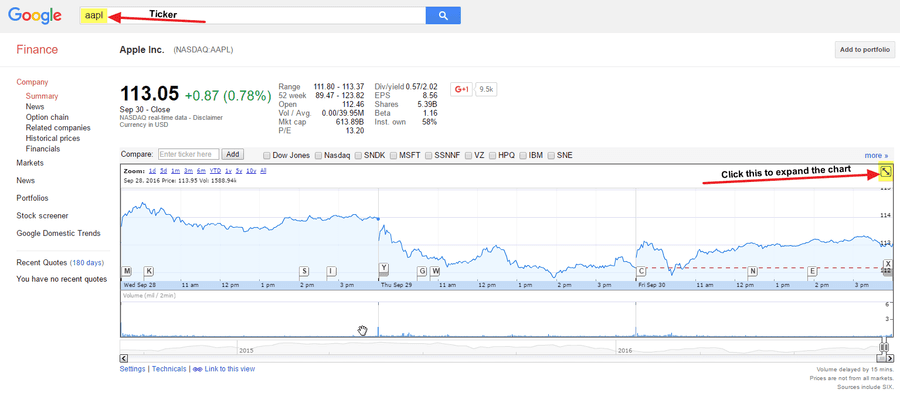
The stock chart
A stock chart is a graph that shows the stock price over a specific period. Advanced stock charts will show additional data. The best website for basic stock information is Google Finance or Yahoo! Finance.
The series of letters after the company's name is the ticker symbol and identifies the company on the stock exchange. For example, AAPL is Apple's ticker symbol. Then click the button to expand the chart to full screen.
43
177 reads
CURATED FROM
IDEAS CURATED BY
The idea is part of this collection:
Learn more about moneyandinvestments with this collection
The importance of innovation
The power of perseverance
How to think big and take risks
Related collections
Read & Learn
20x Faster
without
deepstash
with
deepstash
with
deepstash
Personalized microlearning
—
100+ Learning Journeys
—
Access to 200,000+ ideas
—
Access to the mobile app
—
Unlimited idea saving
—
—
Unlimited history
—
—
Unlimited listening to ideas
—
—
Downloading & offline access
—
—
Supercharge your mind with one idea per day
Enter your email and spend 1 minute every day to learn something new.
I agree to receive email updates
