
Explore the World's Best Ideas
Join today and uncover 100+ curated journeys from 50+ topics. Unlock access to our mobile app with extensive features.

Investing in individual stocks
When you're new to investing, it is best to start with index funds or mutual funds. This will keep your portfolio diversified and reduce risk.
But if you want to move on to invest in individual stocks, a good first step is reading and understanding stock charts.
45
355 reads
The stock chart
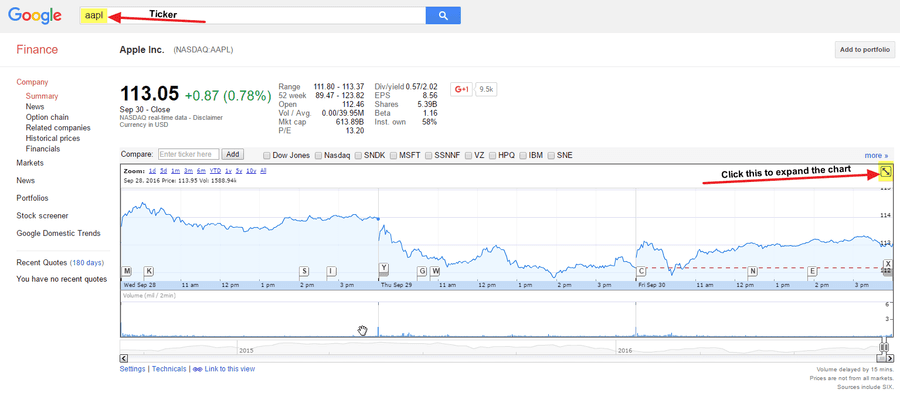
A stock chart is a graph that shows the stock price over a specific period. Advanced stock charts will show additional data. The best website for basic stock information is Google Finance or Yahoo! Finance.
The series of letters after the company's name is the ticker symbol and identifies the company on the stock exchange. For example, AAPL is Apple's ticker symbol. Then click the button to expand the chart to full screen.
43
177 reads
Buy stock on your own with Robinhood
The Robinhood app can make trading easier by analyzing stocks using the quick-to-open charts. Then, filter the chart from one day to five years' worth of performance.
Trades cost $0 with Robinhood if you wish to invest independently.
42
203 reads
Learning to read a stock chart
A stock chart shows historic prices. It is useful when you can decipher what it's showing so you can make more accurate predictions.
- Identify the trend line
- Look for lines of support and resistance
- Know when dividends and stock splits occur
- Understand historic trading volumes.
44
178 reads
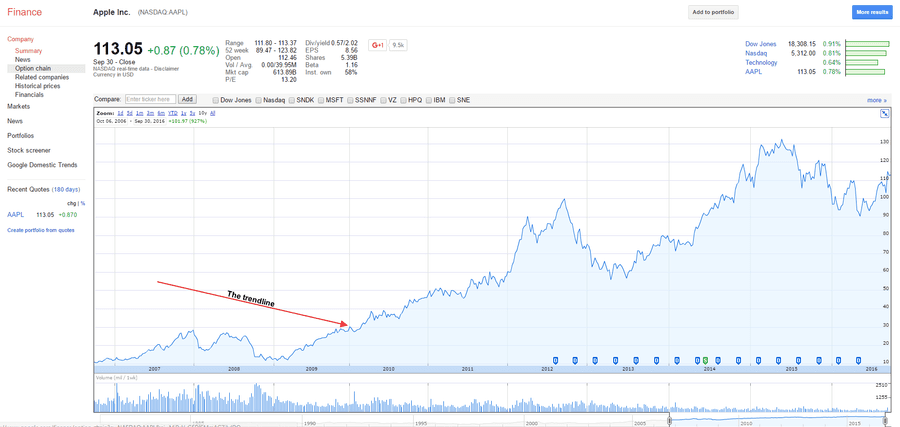
Identify the trend line
It is essential to understand that stocks will take massive dives and make huge climbs. But it is best not to react to these huge drops or gains.
News will come and go, but pay attention to it when news coincides with a drastic change in the trend line. For example, in 2011, Steve Jobs resigned, and Apple noticed that their profit margins were decreasing despite a growing smartphone market. This and other factors caused the stock price to fall. But new CEO Tim Cook turned that around, as noted on the trend line.
While most companies will bounce back, not all can.
42
129 reads
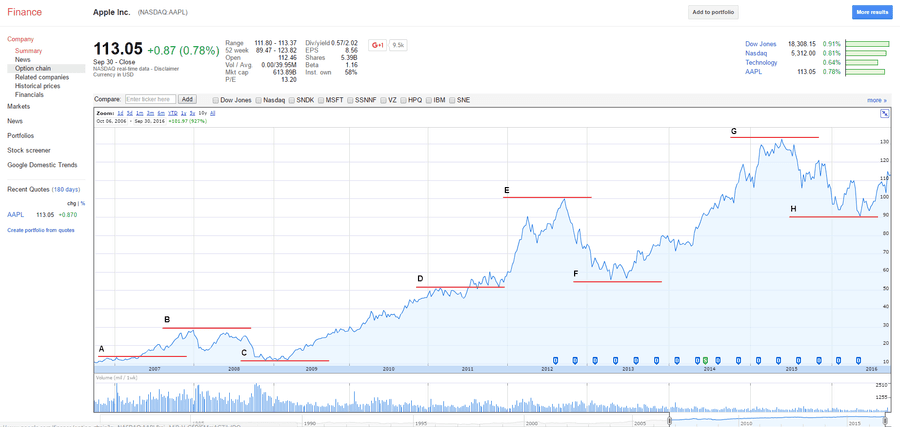
Look for lines of support and resistance
Lines of support and resistance are levels at which the stock stays within over a certain period.
- A level of support is a price that a stock is unlikely to drop below.
- A level of resistance is one that it's unlikely to climb above.
The lines are subjective. Everyone will draw these lines differently, depending on how long they plan to hold the stock. Someone planning to hold stock for a long time won't care as much about the ups and downs, but a short-term investor may draw more lines to analyse trends during a shorter period.
42
109 reads
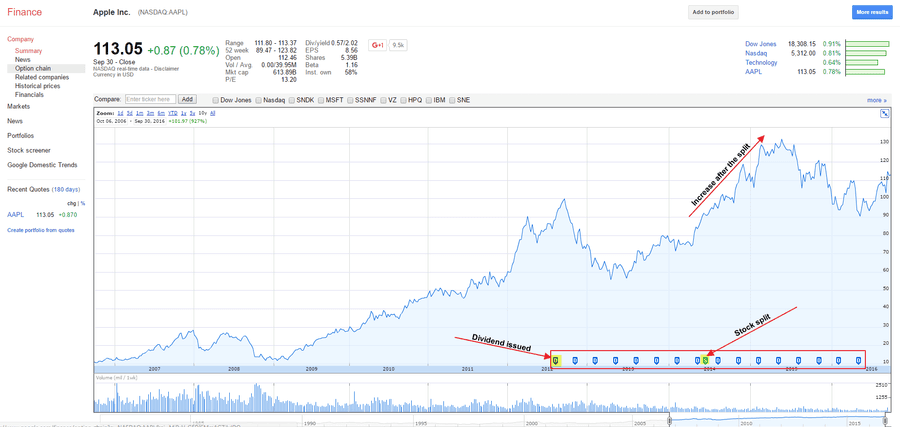
Know when dividends and stock splits occur
You can see at the bottom of the chart when a company issued a dividend and if there was a stock split.
- A dividend is when the company decides to give a portion of its earnings back to its shareholders. (Not all do. Some prefer to focus on growth). If you own the stock, you'll get some of the profit.
- A stock split is when more shares of stock are issued to the public. This is done to attract smaller investors or if the price isn't in line with competitors. For example, Apple did a 7:1 stock split, meaning you now have seven for every share you owned before the split.
43
84 reads
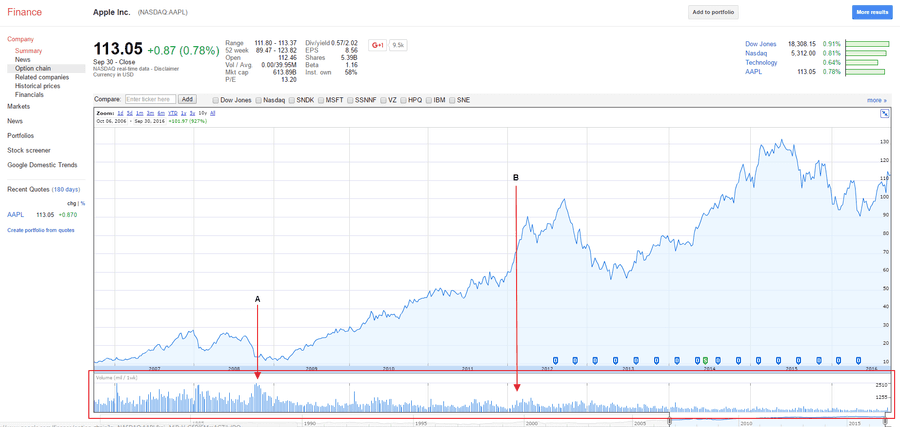
Understand historic trading volumes
At the bottom of the chart are small, vertical lines. This is a trend of the volumes at which the stock is traded.
You should not only focus on volumes when you buy a stock. While there's not always a correlation, sometimes volumes can increase to shift the stock's price quickly.
For example:
- In line A, there was a high volume of trading activity and a drop in the stock price. It could have been news that caused people to panic.
- In line B, there is a slight uptick in trading volume that corresponds to an upward stock price trend.
44
80 reads
Stock trading tools
When you are practised at reading a stock chart, you might be looking for more powerful tools, such as:
- E*trade takes advantage of robust stock charts and trading tools. However, their pricing isn't the best.
- Robinhood. This app gives just enough information to make informed decisions.
- TD Ameritrade. You pay nothing for access to any of TD Ameritrade's trading platforms, streaming news, and expert research.
- Public makes stock trading into a social event. You have access to a community of investors. Public also gives you access to stocks for as little as $5 and offer fractional shares.
44
81 reads
IDEAS CURATED BY

Brandon Garcia's ideas are part of this journey:

Learn more about moneyandinvestments with this collection
The importance of innovation
The power of perseverance
How to think big and take risks
Related collections


Similar ideas

8 ideas
Investing for beginners
moneysavingexpert.com

5 ideas
Understanding a Candlestick Chart
investopedia.com

4 ideas
Heikin-Ashi: A Better Candlestick
investopedia.com
Read & Learn
20x Faster
without
deepstash
with
deepstash
with
deepstash
Personalized microlearning
—
100+ Learning Journeys
—
Access to 200,000+ ideas
—
Access to the mobile app
—
Unlimited idea saving
—
—
Unlimited history
—
—
Unlimited listening to ideas
—
—
Downloading & offline access
—
—
Supercharge your mind with one idea per day
Enter your email and spend 1 minute every day to learn something new.
I agree to receive email updates