
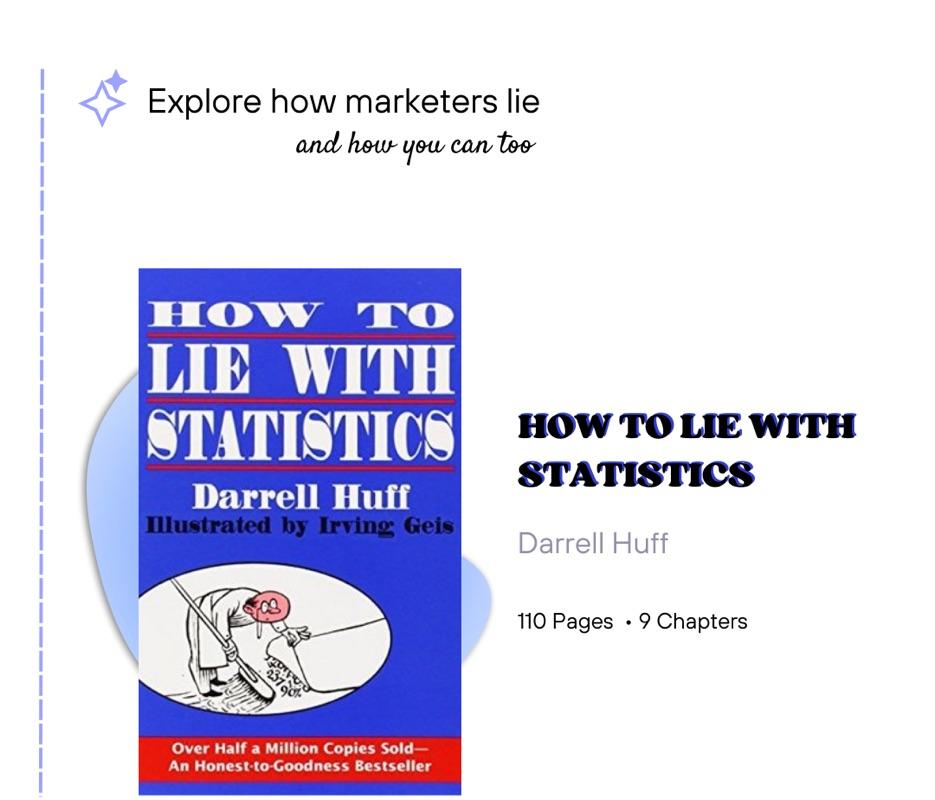
botlhale klassen's Key Ideas from How to Lie with Statistics
by Darrell Huff
Ideas, facts & insights covering these topics:
12 ideas
·2.5K reads
7
Explore the World's Best Ideas
Join today and uncover 100+ curated journeys from 50+ topics. Unlock access to our mobile app with extensive features.
Book Overview
- The book is a quick read filled with fun graphics to help you grasp ideas.
- The author does a good job of covering a variety of topics in a small book.
- However, the book lacks proper explanation of statistic concepts thus if you didn't take a stats class in University you will struggle to understand the concepts.
- There are a lot of practical examples of how these concepts have been used.
21
262 reads

The secret language of statistics is employed to sensationalise, inflate, confuse and oversimplify.
DARREL HUFF
23
288 reads

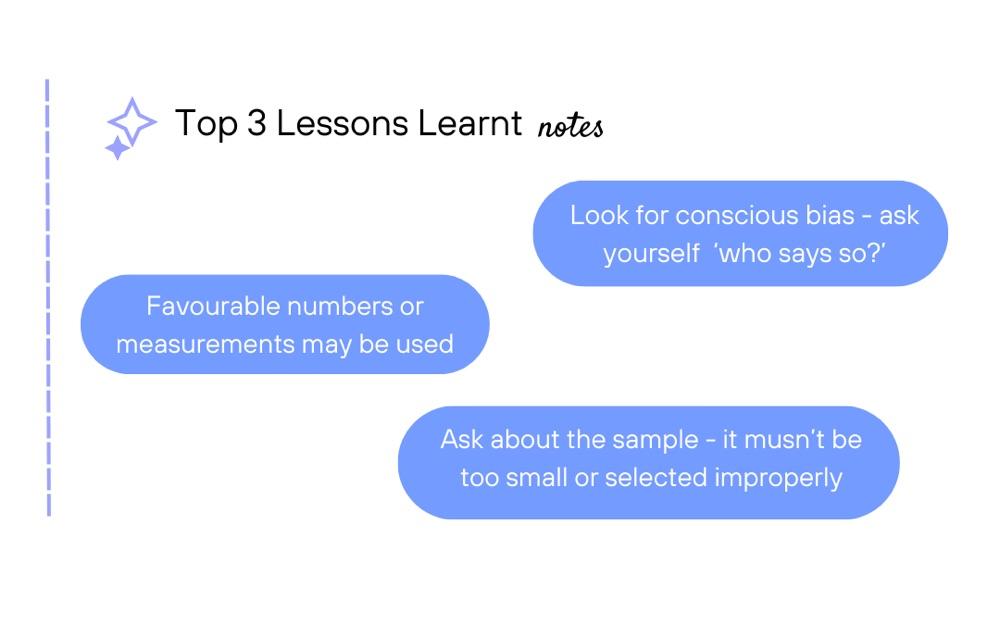
Method 1: Using Samples with bias
- Researchers can intentionally choose a group of people (or things) that have similar traits and thus 'prove' their point.
- This is deceiving because a report based on sampling must use a representative sample - every name or thing in the whole group must have an equal chance.
- Another famous method is choosing a very small sample.
- Depending on the population size, samples sizes must be at least 30% of the population.
24
229 reads

Method 2: Reporting The Wrong Average
There are 3 common averages: mean, median and mode. In some cases, the result of all 3 is the same number but in most cases the numbers are very different!
The Median (middle number) tells you more about the situation. On the left of this number is 50% of the sample on the right is the other 50% of the sample. Thus gives a good overview of what's happening as a whole.
But marketers normally report using the mean (the sum of all numbers divided by the number of units in the sample).
26
198 reads

Averages, Relationships, Trends and Graphs are not always what they seem. There may be more in them than meets the eye, and there may be a good deal less
DARREL HUFF
21
180 reads

Method 3: Missing Figures
- Not including the number of trials the experiment / research took - given a small enough number of cases, random 'by chance' occurrences can happen.
- Leaving out the Degree of Significance - the demanded level is 1% which means there are 99 chances out of 100 that have an apparent difference.
- The Range - this figure tells you the deviation of the sample from the average that is given.
Place little faith in an average or a graph or a trend when those important figures are missing
24
160 reads

More Figures to Look For 👀
- The Probable Error and The Standard Error - these tell you how accurately the sample presents the whole field (or population)
- The Test of Significance (often calculated with the degree of significance)
24
163 reads

Method 4: Exaggerating
To make things seem bigger than what they are, marketers can use these methods / tools
- The Gee Whiz Graph - basically adding more numbers on the graph to create an upward or downward trend that otherwise looked like a straight line.
- Bar Graphs - not using the same size for the bars or objects used
22
140 reads

Only when there is a substantial number of trials involved is the law of averages a useful description or prediction
DARREL HUFF
21
147 reads

Method 5: Make Assumptions
" If you can't prove what you want to prove, demonstrate something else and pretend that they are the same thing "
The general method is to pick two things that sound the same, but are not.
22
141 reads

How To Talk To a Statistic
- Look for conscious bias - ask "Who says so?"
- Ask yourself "How does HE know that?" What methods were used (if any) to acquire that information?
- Does it make sense - use your own intellect to see through the cracks!
23
163 reads
IDEAS CURATED BY

welcome 🤗, sharing my obsession with non-fiction books about marketing, business, productivity, relationships and spirituality🤍
CURATOR'S NOTE
Let's explore how marketers lie using statistics (👀 and how you can too)
“
Different Perspectives Curated by Others from How to Lie with Statistics
Curious about different takes? Check out our book page to explore multiple unique summaries written by Deepstash curators:
10 ideas
Discover Key Ideas from Books on Similar Topics
4 ideas
Detecting Lies and Deceit
Aldert Vrij
16 ideas
The Richest Man in Babylon
George S. Clason
18 ideas
The Obesity Code
Jason Fung
Read & Learn
20x Faster
without
deepstash
with
deepstash
with
deepstash
Personalized microlearning
—
100+ Learning Journeys
—
Access to 200,000+ ideas
—
Access to the mobile app
—
Unlimited idea saving
—
—
Unlimited history
—
—
Unlimited listening to ideas
—
—
Downloading & offline access
—
—
Supercharge your mind with one idea per day
Enter your email and spend 1 minute every day to learn something new.
I agree to receive email updates