
OLS (Ordinary Least Square) Assumptions
Ideas, facts & insights covering these topics:
13 ideas
·433 reads
2
Explore the World's Best Ideas
Join today and uncover 100+ curated journeys from 50+ topics. Unlock access to our mobile app with extensive features.
What is Ordinary Least Square Method?
Ordinary least squares, or linear least squares, estimates the parameters in a regression model by minimizing the sum of the squared residuals.
2
94 reads
Assumptions for OLS
OLS Assumptions are the Conditions that we need to consider them before performing Regression Analysis.
Some OLS Assumptions are:
- Linearity
- No Endogeneity
- Normality
- Zero Mean of Error Terms
- Homoscedasticity
- No Autocorrelation
- No Multicollinearity
2
64 reads
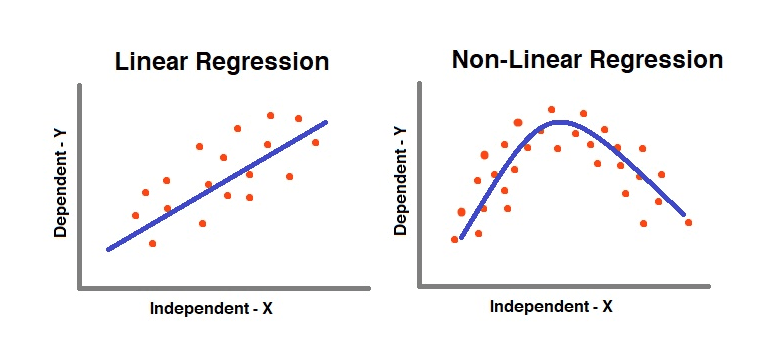
1. Linearity
- A Linear Regression is Linear because the Equation is Linear.
- To verify the Linearity between Independent and Dependent Variable apply Scatter plot.
- If the Data points form a pattern that looks like a Straight Line then Linear Regression is Suitable.
2
41 reads
Non-Linear Pattern
If the pattern doesn't looks like a Straight Line, then we need to apply
- A Non Linear Regression or
- Exponential Transformation or
- Log Transformation.
2
38 reads
2. No Endogeneity
- Technically, Endogeneity occurs when a predictor variable (x) in a regression model is correlated with the error term (e) in the model.
- This usually occurs due to the Omitted Variable Bias (when we forget to include a relevant variable in the Model).
- As the thing that we don’t explain with our model goes into the error, the error would be correlated to the variable that we have omitted.
- Omitted Variable Bias is hard to find. When in doubt, include the Variable in the model and try it yourself.
2
27 reads
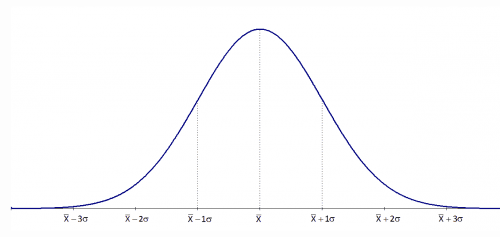
3. Normality of Error Terms
- We need to consider that our Error Term is normally distributed.
- We only need Normal Distribution while making Statistical Inferences.
- T-tests and F-tests work because we have assumed normality.
- If Error Term isn't normally distributed then we can use Central Limit Theorem.
2
25 reads
4. Zero Mean of Error Terms
- If the Mean of the Error Terms is not expected to be zero then the line is not the Best fitting one.
- Having an Intercept Solves the problem.
2
24 reads
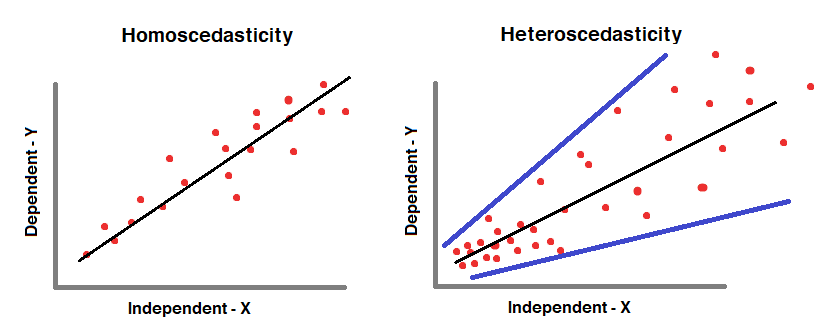
5. Homoscedasticity
- Homoscedasticity means to have “Equal Variance”. The error terms should have equal variance with one another.
- When the error terms don’t have “Equal Variance”, then Heteroscedasticity happens.
2
21 reads
Heteroscedasticity
In order to prevent Heteroscedasticity, we need to
- Look for Omitted Variable Bias.
- Look for Outliers.
- Apply log Transformation.
2
21 reads
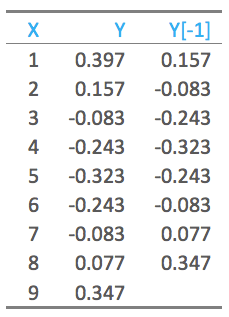
6. No Autocorrelation
- Autocorrelation is a mathematical representation of the degree of similarity between a given time series and a lagged version of itself over successive time intervals.
- It is similar to the Correlation between two different Time Series but Autocorrelation uses same time series twice.
- One is Original form and other one is Lagged version of Original form.
2
19 reads
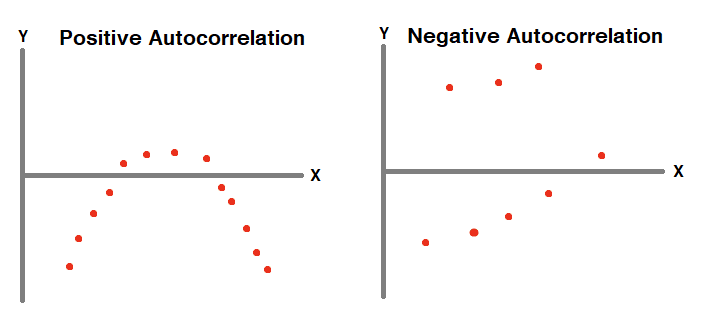
Autocorrelation Detection
To detect autocorrelation
- Plot all points and check for patterns or
- Use Durbin - Watson test.
There is no remedy for Autocorrelation. Instead of linear regression, we can use
- Autoregressive Models.
- Moving Average Models.
2
17 reads
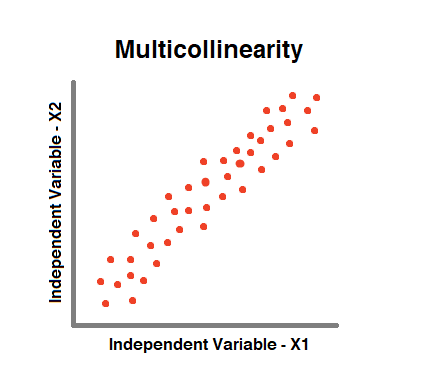
7. No Multicollinearity
- We observe Multicollinearity when two or more Independent Variables in a model are “Highly Correlated”.
- Correlation could be Positive (or) Negative.
- This will lead result in less reliable predictions.
- Multicollinearity can be noticed easily by finding the correlation between each two pairs of Independent Variables.
2
19 reads
Fixing Multicollinearity
To fix Multicollinearity:
- If the Dataset is small, we can drop one independent variable. Or we can Transform them into One Variable (Eg. Average of two Variables)
- If the Dataset is large, we will use Ridge and Lasso Regression.
2
23 reads
IDEAS CURATED BY

CURATOR'S NOTE
These are some of the Assumptions to be pondered while Applying Ordinary Least Square Method and Performing Regression Analysis.
“
Similar ideas
2 ideas
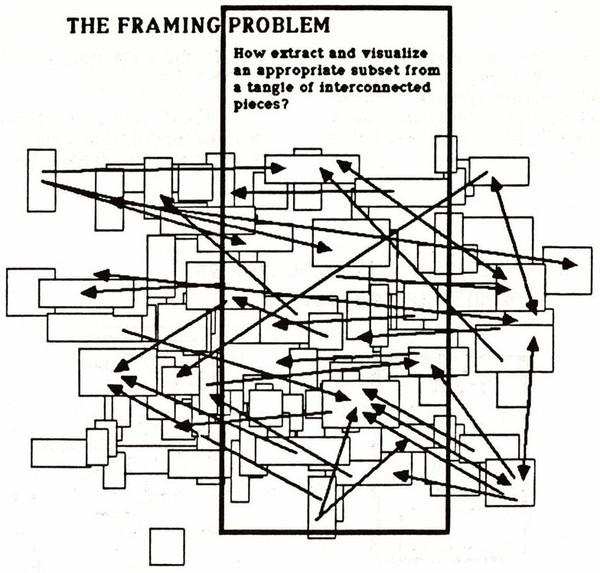
Long form content is like Legos
subconscious.substack.com
9 ideas
Time Warrior
Steve Chandler
Read & Learn
20x Faster
without
deepstash
with
deepstash
with
deepstash
Personalized microlearning
—
100+ Learning Journeys
—
Access to 200,000+ ideas
—
Access to the mobile app
—
Unlimited idea saving
—
—
Unlimited history
—
—
Unlimited listening to ideas
—
—
Downloading & offline access
—
—
Supercharge your mind with one idea per day
Enter your email and spend 1 minute every day to learn something new.
I agree to receive email updates